Introduction
The methodology would describe the process taken into consideration to evaluate student motivation. Student motivation in Health Career programs is highly critical to ensure that there is a strong performance in these programs. This will also decide on the attrition rates, persistence in learning, and student retention, in the college as well as later during the work situation. To identify the levels of motivation of various students across the course that they are doing, the following methodology has been designed. This would help in also judging the nature of factors that do not motivate them and the ones that increase the motivational levels of these students. The research methodology presented here does take into consideration this requirement and presents the details below.
Research Design
To conduct this study, a quasi-experimental design is made. The rigorousness of the design is built-in by bringing an internal validity for the work that is done. A survey is planned. The survey will be conducted on two fronts; one, with the students and the other with the tutors of the college. This will help in identifying the nature of problems that are faced by the tutors when the students are not motivated and their reaction to the same is needed to find out the levels of motivation the students are experiencing. On the other hand, the motivational levels as perceived by the students themselves are also important. However, it should also be noted that direct questions might not invoke the true response from the respondents since they could be internally prejudiced and even the respondent might not be aware of the same.
To identify the motivational levels in the students, the Academic Motivation Scale (AMS-C 28) as suggested by Robert Vallerand et al (1989) has been employed in this research. This uses a 7 point Likert scale modified to suit the motivational levels of the students. The questions for the questionnaire have also been framed by the author and the same is made use of here. The questionnaire is grouped to identify the intrinsic, extrinsic, and motivation levels of the students who are responding to it. The questionnaire is given in the annexure and the data collected will be employed for further analysis and reaching an appropriate conclusion. As indicated by Vallerand, et al, the three different states of motivation, will decide on the level of interest the person might take in the studies that he or she has at hand. The extrinsic motivation and its four distinguishing types (Deci & Ryan 1985) moving over the extrinsic continuum when one moves and becomes intrinsic (Deci & Ryan 2000) before getting into the motivation. The external motivated situation is the least self-determined of all the motivation styles that the authors talk of.
This questionnaire aims at measuring both the extrinsic and intrinsic motivation levels. At the same time, they will also help in identifying the amotivation level in play. Further analysis will be done based on the outcome of the data from these questionnaires.
A total of 520 students from various groups were selected and the instrument was administered to them. The process of administering will involve seating them in groups of 40 students and the conductor will read out the instructions for the students to understand. After informing the students how to proceed with the instrument, the students are required to answer these questions. The average age of the students and the gender spread were also noted. All the students were given adequate time to complete every instrument before moving on to the next. After administering the instrument, the responses are collected. This will be later used for collecting the data and analyzing the needed information.
Metrics Employed
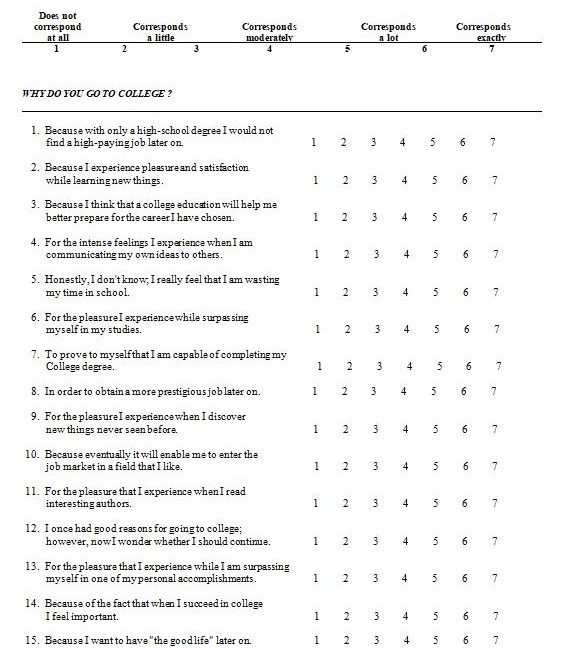
The measures employed followed the standard research patterns already established for this purpose. The Academic Motivational Scale was employed for this purpose. The AMS consists of 28 items in the entire set where the students are expected to answer the question, why do they go to college. This question is answered in 28 different ways and the student will rate every one of them to ascertain his interest factor. This scale can further be divided into seven subscales. These subscales are:
- Amotivation
- External Regulation
- Introjected Regulation
- Identified Regulation
- Intrinsic Motivation to Know
- Intrinsic Motivation to Experience Stimulation
- Intrinsic Motivation to Accomplish
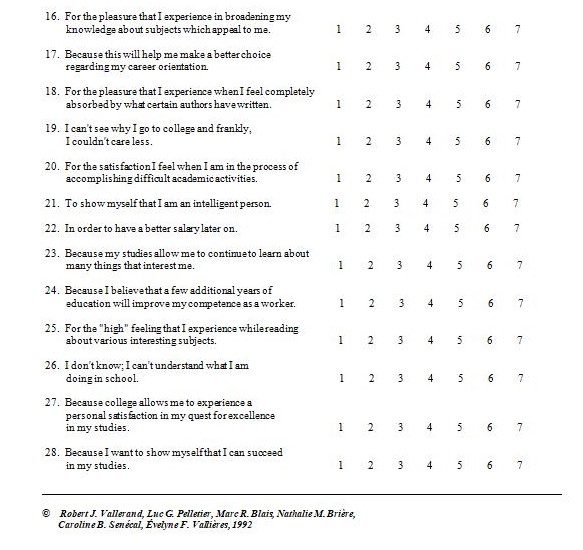
Every one of the options provided to the student is given with seven different scaling values. This will help the student in judging whether the suggested answer corresponds fully or does not correspond at all. He marks from 1 to 7 any of the seven options available depending on the suggestion’s correspondence. Every one of the sub-scale consists of four suggestions. This means a sub-scale may have a value range of 4 to 28 in all. If someone should pick up a seven on a scale, then it is a high endorsement for that kind of motivation. The related suggestions for a sub-scale can be added up to realize the level for the particular motivation. For instance, ‘I once had good reasons for going to college; however, now I wonder whether I should continue, is a suggestion that is a measure of the Amotivation.
Similarly, ‘Because of the fact that when I succeed in college, I feel important’ is an example of Introjected Regulation. Every one of the options is grouped under the sub-scale in the same way. See Annexure I below.
This instrument would, therefore, have scales to identify the motivational levels of the students in every one of the subscales. And the overall intrinsic, extrinsic, and amotivation can also be measured using these scales. Every one of our hypotheses and the objectives of the research is aimed at collecting information about the student motivation and identify the relationship with other statistical information. For instance, the relationship between motivation and student performance in health career courses is to be checked. Similarly, motivation needs to be related with other statistical information such as attrition rates in health career courses, the academic persistence of the students, and performance of the students in terms of GPA are some of them. The hypothesis also aims at comparing the motivation levels of the students at a suburban community college. In addition, the amotivation of the health career students in the suburban community college is also to be measured and noted to ensure that the students are better motivated and have the tendency to continue with their education.
For this and the rest of the relationships that are needed can only be judged based on the statistical information that could be obtained from the educational statistics of the Illinois Government sites. This will be subsequently used during the analysis phase to judge the relevance of the study concerning the performance indexes that are normally considered.
Selection of Respondents
The selection of respondents is done using any of the random selection procedures. This would ensure that the people who are selected to respond are not from uniform backgrounds. The students are selected uniformly from the cross section of courses which need to be verified. A total of thirteen different programs are included in the program. They include the following:
- Nursing
- Nursing Assistant
- Respiratory Care
- Surgical Technology
- Diagnostic Medical Sonography
- Emergency Medical Technology
- Fire Science Technology
- Nuclear Medicine Technology
- Radiologic Technology
- Ophthalmic Technician
- Eye Care Assistant
- Medical Coding and Billing
- Pharmacy Technician program
The study is expected to through light on the attrition rates and motivation levels across every one of these courses. There is a comparison that has to be done across these programs. For this to be effective, the sampling should be uniformly spread across the thirteen courses. Though the selection of the participants is random, the respondents should be equally distributed across these thirteen programs. Since a total of 500 respondents were selected, a set of 40 students are selected from every one of the courses listed above. This will ensure that the students are uniformly distributed at the same time, the response will also have a cross section that is notable for its uniformity and distribution.
Therefore, there is a choice of forty people made in every group of people studying in the respective courses. However, it may be noted, that the course itself in some cases could have more one year duration. This could have multiple numbers of batches in every course. During these conditions, uniform distributions of students are taken from a course and batch delimitation is ignored. This way the number of samples from every course will remain constant and a uniform spread is realized.
But for this, the choice of respondents is random within every course. This would ensure that the right cross sections of people participate in the research exercise and there is a good mix of all the sections of students. The selection and their responses are easier to tabulate and analyze this way.
Validation of the Scale
The Academic Motivation Scale 28 as proposed by R J Vallerund et al is made use of in this project. The validity of this scale can be evaluated using the existing literature in this regard. Desi and Ryan (1985; 2000) proposed in their self determination theory that every human being is motivated to a great degree by the intrinsic motivation of the person. This is the natural drive that a person will have when their own psychological needs are fulfilled. According to Desi and Ryan, the self determination theory proposes that the intrinsic theory is characterized by three psychological needs that remain a part of the motivation. These are the need for competence, the need for autonomy and the need for relatedness. When these are met then, the intrinsic motivation makes full thrust. And these needs are either fulfilled by the social customs and support offered. This would make the person attain better intrinsic motivation if met.
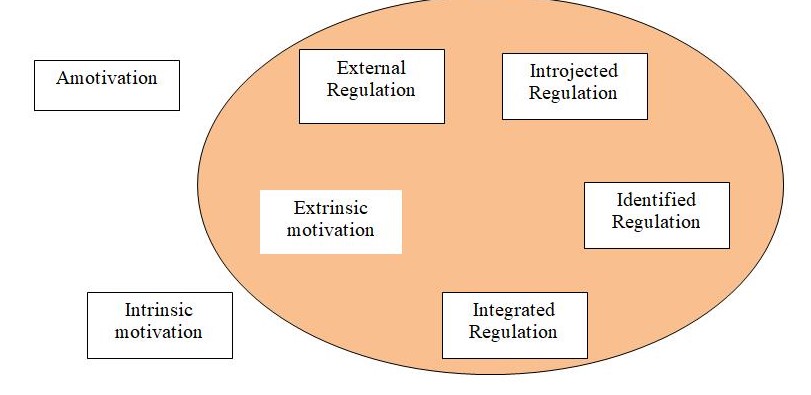
The extrinsic motivation is something that is realized when the person pursues a job because of other extraneous conditions such as money, social status and other such situations. Desi and Ryan (1985) illustrate that four different types of extrinsic motivation is found to act in the system proposed based on the self determination theory. These are external regulation, introjected regulation, identified regulation and integrated regulation. As per the self determination theory, the motivation is spread across a continuum that varies or moves from intrinsic motivation to extrinsic and then on to amotivation. That is, the variation or movement of the motivation happens from a deeply extrinsic motivation which is the external regulation to the integrated regulation and has more and more of intrinsic motivational features in the behavior of the person.
So, it can be taken to mean that the integrated regulation is more of intrinsic motivational features rather than the extrinsic features. As the continuum progresses into the intrinsic motivation more and more of these features dominate. On the other end is the amotivation beyond the extrinsic motivation. Please see figure 1.
Vallerend et al (1992) broke the intrinsic motivation into three different groupings viz., the intrinsic motivation to know, intrinsic motivation to achieve and finally, the intrinsic motivation to experience stimulation. It has been suggested by previous researchers (Grolnick & Ryan 1989; Sheldon & Kasser 1998) that people who are motivated intrinsically tended to have better performance at all levels. They could score better and they could also derive more satisfaction out of life activities.
To understand the ruling motivations of an individual the metrics defines should be able to highlight and identify the motivations in place. Generally, it is accepted that validity of a scale is not just in one measurement but in ensuring it performs uniformly across all cross sections of samples and produces results that are consistent to a great degree. Only then can the instrument designed can be taken to be valid (Messick 1995). Benson (1998) proposes the methodology to check the construct validity of an instrument. According to him, there should be three components that make up the construct validity evaluation of any instrument. The substantive component is the theoretical and empirical part of the instrument that would help in representing the potential variables with appropriate measuring methods. The structural component is the one that stands the examination of the relationships with statistical analysis processes such as the correlation analysis, reliability analysis and others. The external component, finally, is the one that establishes a ‘nomological net’ by establishing and examining the identifiable relationships between the constructs. It is widely held by the researchers that the external component is very important in fixing the validity of a scale (Benson 1998).
Validity evidence of the scale has been presented by Vallerand et al, themselves after repeated and continued evidence building. In their report in 1992, Vallerand reported that the Confirmatory Factor Analysis (CFA) of the seven factor structure was adequate. However, this was realized by him after making 26 error covariances built into the model. According to him, the Cronbach’s alpha coefficients ranged from 0.83 to 0.86 for the sub scales. He also reported an internal consistency of 0.62. There was also a test-retest reliability factor for the scale observed using his values over one month and this ranged from 0.71 to 0.83 for the sub scales. This made the scales closer to acceptability.
Vallerand et al (1993) further reported problems on the intrinsic motivation – stimulation sub scale. The weak correlations reported during their later studies confirmed the existence of this weakness in the scale and therefore, raises a question on the construct validity of this particular sub scale. Their study also failed to substantiate the Deci and Ryan’s continuum theory of the motivation and the self determination. They tried to establish a simplex pattern which should be true if the self determination continuum exists. But this could not be established. This could also be seen as the limitation of the scale and the weak correlations that exist in the subscales.
Cokley (2000) who studied the American college student motivation, also found that the simplex pattern was not fully supported and had weak correlations which was anti to the existence of such simplex pattern. There was a strong negative correlation between the identified regulation and amotivation whereas it was weaker between amotivation and the intrinsic motivation types that were proposed by Vallerand et al (2003). This however, matched the proposals made by Vallerand et al. Cokley (2000) further studied the efficiency of this scale in identifying the effect of the motivation on the GPA of college students. Though, the states that the scale was not an exact fitment model for the performance, it was however, better than the other scales based on five factor, three factor or two factor models. Since they found the variation in the scale was substantial though better, the authors suggested a relook at the ‘underlying factor structures and the construct validity’ of the scores. However, it should be noted that the 28 point seven factor model is taken and considered as the best of the scales available for modeling motivation.
Procedures
The following procedure is employed while conducting and offering the instrument for the study.
- A total of 520 students were selected from various course offered in the sub urban college of health. The spread of these students were taken to be as stated in the research plan; equally distributed across all the courses.
- The AMS 28 scale was administered to them. Since all the students could not be assembled at the same point in time, the administration of the instrument is done by assembling 40 students at a time. This was repeated until all the students who were shortlisted for participation have given their instrument filled in.
- Every student was given adequate time to fill after the instructions were completed fully.
- The completed instruments were then taken and the values were entered into a computer using SPSS. The t-test and ANOVA were employed for analyzing the extent to which the correlation exists between the factors taken into consideration. All the seven factors are taken into consideration and the values entered into the system. The analysis was carried out in line with the details specified in the analysis section below.
- Based on the analysis and the values obtained the hypothesis are ratified with the results and the same is presented at the end of the report. The substantiation of the scale as well as the hypothesis is held based on the results obtained.
Analysis
The data collected out of the administration of the instrument is used for further analysis. This is carried out in the following manner:
- The model fitment is the first test that has to be carried out to ensure that the model taken for consideration is in line with the needs of the research. The x2 test is normally considered the best test for substantiating a model fitment. Most of the researchers do not look for an exact fitment of the model but an approximate fit. Whereas, the x2 is for a stringent fit particularly when the number of participants in the sample becomes larger. Therefore, in addition to the x2 test, the Root Mean Square Error of Approximation (RMSEA) and the Comparative Fit Index (CFI) were also employed to determine the extent of fitness the model had with the data collected. While RMSEA is a negative index indicating the extent of misfit that is present in the model, the CFI is a positive fit and indicates the extent of fitment the model has with the data (Browne & Cudeck 1993). The RMSEA is very sensitive to factors that make up the model and any misspecification could give rise to a large variation in the factor. According to Hu & Bentler (1999), a value of 0.06 or less indicates that there is an adequate fit. The CFI is also sensitive to minor variations in the misspecified factor loadings. CFI varies between 0 and 1. And in this case, the higher the index value, closer to 1, the fitment is better. The fitment of the model is first evaluated using either of the indexes. Both of them are calculated to identify the extent of fit the model is to the data that is present in the current collection.
- The data present is then subjected to analysis. Specific analysis of the kurtosis is identified. In addition to the univariate or bivariate kurtosis that the data displays, the data is checked for positive kurtosis and identified whether any specific variation and result adjustments are needed to ensure that the values are more uniformly laid. The Maximum Likelihood estimation is checked for its robustness. This will ensure that the positive kurtosis will be remote in such cases (Chou, Bentler & Satorra 1991).
- The data is entered into SPSS computer software version 12.0 for easier analysis of correlation coefficients and the rest of the values.
- The typical variables that are identified for our current research would include the seven factors of motivation representing the sub scales of the AMS 28. The analysis will identify the variation and intercorrelations among these measures of identification. The variation will also be corresponded with the other academic performance measures such as the GPA and the attrition rate of the institute for every one of the course. In addition to these general variables that are taken in for correlation, the other variables included are:
- Academic Persistence
- Student retention rate
- Attrition rates in a suburban college
- ANOVAs are conducted to identify variations and differences in the data due to variations such as age and gender. Also, the same was used to identify differences among GPA scores which is part of the hypothesis. ANOVA is also employed to identify the differences concerning the courses as well. The motivational levels and the variation in them between such factors are brought out using ANOVAs (Clarke GM & Cooke D 1998). While conducting the ANOVA test, suitable compensation to any undue variations are taken into account. To do this, Scheffe Post-hoc test is employed so that mean compensation is taken into consideration. In addition to this, t-test is also performed for independent samples particular between the courses where the values do not have relationships with one another.
- The variations can also be done on a single way ANOVA. However, on the SPSS a two way ANOVA can also be brought about. Two independent variables can be taken into consideration with one dependent variable value to ensure that a two way ANOVA is identified. This will bring about the relationship between the variables. This is particularly true in the case of inter-relationship of the variables such as, GPA and two of the sub scales identified among the intrinsic motivation factors. Similar analysis is carried out with the help of the other sub scales as well for the extrinsic motivation factors and the intrinsic factors as well.
- Using the means of the factors thus identified, SPSS can also show the correlation between the factors and their means. Therefore, the means can also be calculated out of the factors that are being related and tested and their relationship are also checked during the analysis.
- The mean square deviation of the between class (MSSb) and the mean square deviation of the within class (MSSw) are noted. Using these means the Fischer statistic F is worked out as F = MSSb / MSSw
- The F values are plotted as a graph to know the F distribution curve indicating the points where the 5% and 1% variance intervals could be easily identified.
- Though the data has been gathered at different points in time from the sample lots, the values are still collected within a specified time slot. Therefore, there could be inaccuracies related to time based responses of the students (Satorra & Bentler 1994). Specific motivational points are lower during a particular period in the course while higher at certain others. This can also vary with individuals. A suitable compensation has been worked out to ensure that this variation is adequately compensated during analysis. For this purpose, a covariance variable is included to reduce the error component that might arise in the calculations and projections.
Conclusion
The methodology espoused here takes care of the research objectives and aims already presented and based on this methodology the research conclusions can be successfully reached. This makes use of the right computerized and statistical tools to ensure that the values are fully employed to reach the conclusion and results that are valid. This method however, has its shortcomings, primarily of the following reasons:
- This study does not look at the data from the gender point of view and this could lead to a mix of information though the overall outcome may not get affected. However, a gender based result analysis might not be forthcoming.
- The results are not aimed at providing long term attitudinal correction measures or any suggestions to bring about the change of scenario. This however, is not in the scope of the study undertaken. The results may be used to find and identify the changes that are needed to bring about positive changes among the students.
- The instrument employed has been validated both theoretically and empirically. However, this is not completely validated and there are inconsistencies as has been brought out elsewhere in the earlier pages.
- The participants were informed that such an instrument will be administered and most of them were ‘prepared’ for it. The answers given were not spontaneous and could carry prejudice even thought the load of the prejudice on the responses could be limited. Therefore, this factor must be avoided in the future research exercises.
- Interpretations of many of the results are highly individual driven though there are several motivational factors that are quantized. Still the interpretation could vary with the researcher though there is no preconceived prejudice on the part of the researcher in any of the matters of interest mentioned herein.
These negative factors have to be taken into consideration while judging the impact of the research outcome.
References
- Benson, J. (1998). Developing a strong program of construct validation: a test anxiety example. Educational Measurement: Issues and Practice, 17, 10-17.
- Browne, M. W., & Cudeck, R. (1993). Alternative ways of assessing model fit. In K. A. Bollen & J. S. Long (Eds.), Testing structural equation models (pp.136 – 162). Newbury Park, CA: Sage.
- Chou, C., Bentler, P. M., & Satorra, A. (1991). Scaled test statistics and robust standard errors for non-normal data in covariance structure analysis: A Monte Carlo study. British Journal of Mathematical and Statistical Psychology, 44, 347 – 357.
- Clarke GM & Cooke D (1998) A Basic Course in Statistic. Chapter 22, Arnold, pp 520 – 546,
- Cokley, K.O. (2000). Examining the validity of the academic motivation scale by comparing scale construction to self-determination theory. Psychological Reports, 86, 560-564.
- Deci, E.L., & Ryan, R.M. (1985). Intrinsic motivation and self-determination in human behavior. New York: Plenum.
- Deci, E.L., & Ryan, R.M. (2000). The “what” and “why” of goal pursuits: human needs and the self-determination of behavior. Psychological Inquiry, 11, 227-268
- Grolnick, W.S., & Ryan, R.M. (1989). Parent styles associated with children’s self-regulation and competence in school. Journal of Educational Psychology, 81, 143-154.
- Hu, L., & Bentler, P.M. (1999). Cutoff criteria for fit indexes in covariance structure analysis: Conventional criteria versus new alternatives. Structural Equation Modeling, 6, 1-55.
- Messick, S. (1995). Validity of psychological assessment: Validation of inferences from persons’ responses and performances as scientific inquiry into score meaning. American Psychologist, Vol.50, 741-749.
- Satorra, A., & Bentler, P. M. (1994). Corrections to test statistics and standard errors in covariance structure analysis. In A. vonEye & C. C. Clogg, (Eds.), Latent variables analysis: Applications for developmental research. Thousand Oaks, CA: Sage.
- Sheldon, K.M., & Kasser, T. (1998). Pursuing personal goals: Skills enable progress, but not all progress is beneficial. Personality and Social Psychology Bulletin, 24, 1319-1331.
- Vallerand, R.J., Pelletier, L.G., Blais, M.R, Brière, N.M., Senécal, C., & Vallières, E.F. (1992). The academic motivation scale: a measure of intrinsic, extrinsic, and amotivation in education. Educational and Psychological Measurement, 52, 1003-1017.
- Vallerand, R.J., Pelletier, L.G., Blais, M.R, Brière, N.M., Senécal, C., & Vallières, E.F. (1993). On the assessment of intrinsic, extrinsic and amotivation in education: Evidence on the concurrent and construct validity of the academic motivation scale. Educational and Psychological Measurement, 53, 159-172.
Annexure I
WHY DO YOU GO TO COLLEGE ?
Using the scale below, indicate to what extent each of the following items presently corresponds to one of the reasons why you go to college.
KEY FOR AMS-28
# 2, 9, 16, 23 Intrinsic motivation – to know
# 6, 13, 20, 27 Intrinsic motivation – toward accomplishment
# 4, 11, 18, 25 Intrinsic motivation – to experience stimulation
# 3, 10, 17, 24 Extrinsic motivation – identified
# 7, 14, 21, 28 Extrinsic motivation – introjected
# 1, 8, 15, 22 Extrinsic motivation – external regulation
# 5, 12, 19, 26 Amotivation