Data visualization can be defined as a graphical depiction of various data and information. The use of different maps, graphs, and charts could be exceptionally helpful because it could aid researchers in understanding data trends and patterns (Golfarelli & Rizzi, 2020). Since the concept of Big Data continues to evolve and penetrate more areas of information technology usage, the new massive amounts of data have to be analyzed and presented in a reasonable way. This has to be done in order to generate viable data-driven decisions and leave no information unprocessed to make future visualizations as exact as possible (Medvedev et al., 2017). Humans prefer to explore visual content because it stimulates their creativity and offers them an opportunity to step away from going through incredible amounts of textual information (Olson & Lauhoff, 2019). The visual culture of nowadays dictates the need to explore data visualization techniques and improve data mining at the same time. The issue of data visualization has to be studied further because the overall effectiveness of data mining depends on it.
Background
At the moment, it can be safe to say that the age of Big Data requires scholars and researchers to pay more attention to data visualization because of the increasing amounts of data that can be generated through human effort or even automatically. Therefore, data curation plays an important role in the development of data mining because trends have to be highlighted more effectively, with outliers and inclinations being separated from the general flow (Peral et al., 2017). In other words, data visualization serves as a priority because it contains valuable information that has to be considered when making data-driven decisions. The forms and functions included in the process of visualizing big data also depend on how efficient a data analyst is in terms of balancing between simplicity and informativeness (Aldowah et al., 2019). As a cycle in data mining, data visualization plays a crucial role because it has to be powerful enough to draw attention and communicate specific ideas. This means that the visualization and information sources have to be considered altogether, as otherwise, data analysis and representation are going to be flawed.
Research Aim
Data visualization should be regarded as the primary element of data mining that sets up the interaction between available data and a data analyst. The research aim that the author of the current proposal pursues is to gain more insight into the biggest issues associated with data visualization. The significance of the proposed research project can be explained by the fact that a straightforward analysis of available information is not always followed by a detailed and representative data visualization. Accordingly, the sources of input and output information depend on data perception and the ways in which researchers treat data visualization methodologies.
Motivation and Objectives
Every professional industry nowadays benefits from the existence of Big Data and a number of reasonable instruments that help analysts make the best use of various insights. It can be stated that the motivation behind the researcher’s effort to investigate issues related to data virtualization revolve around a mix of smaller problems stemming from employee education, relations with consumers, marketing, and other organizational elements (Roiger, 2017). Thus, real-life applications of data virtualization have to be explored in richer detail in order to highlight a series of benefits and limitations of the use of Big Data. Also, data visualization can be a crucial professional skill that might aid data analysts and give them more opportunities to share data. The primary objective of the proposed study will be to investigate literature on the subject and conduct a detailed meta-analysis of available literature. The secondary objective of the research project is to come up with a list of strategies that professional data analysts could utilize to improve data visualization and data mining processes. These findings might significantly contribute to the future methodology of educating data analysts and ensuring they can engage in powerful visual storytelling while avoiding certain shortfalls that can be associated with data visualization.
Literature Review
The primary that has to be investigated when dwelling on data visualization is the increasing number of solutions where data are oversimplified for no significant reason. For data analysts, this means that the amounts of collected data increase on a daily basis, but there are fewer understandable, unified terms that could be utilized to describe every data set (Slater et al., 2017). Even though it is possible to simplify the evidence and overcome some of the complications, the overall scenario does not seem too positive when visual representations require the audience to engage in additional research. The lack of supporting evidence stems from the challenging nature of having to reduce the amount of factual information included in any given visualization (Pathak & Pathak, 2020). In other words, some of the conclusions could remain unfounded because of the minimal amount of evidence available for analysis. Without any real-world investigations, it can be exceptionally hard for researchers to simplify data sets without losing important data points. This factor could also damage data validity and the process of visualization as a whole.
Another reason why data visualization deserves additional attention from researchers is the inextricable nature of human limitations affecting data processing algorithms. This factor poses a significant threat to accurate data visualization because data is reduced in accordance with the presets that have been developed and deployed by humans (Qin et al., 2018). Any human input could be flawed, meaning that the presence of human error affects data visualization rather negatively. The most important factors considered by a certain data scientist could be marked as trivial by a different analyst. It is an exceptionally complex task that goes hand in hand with data mining and visualization because of the lack of reasonable substitutions. Additional opportunities have to be considered to ensure that exclusively human decision-making is never prioritized over any hybrid systems where highly trained artificial intelligence helps make informed decisions (Rutkowski et al., 2020). On the one hand, there can be bits of information overlooked by human analysts. On the other hand, there is no one-size-fits-all algorithm that would address the specific needs of every particular end-user.
The ultimate problem that cannot be eradicated from the discussion on the topic of data visualization is the increasing prevalence of data analysts over-relying on visuals regardless of the given scenario. Even though it is a much bigger problem among consumers and not developers, the undermining nature of inconsecutive data representations damages the process of visualization and leaves less room for maneuvers. Consistent with Bandaru et al. (2017), the willingness to include visualizations in every project and report often damages the quality of the final product instead of supporting it. It happens because visualizations, as a mode of input, are limited to individual perceptions and cannot be mediated to appeal to every end-user. Accordingly, incomplete or outright flawed conclusions could be presented as a universal truth, averting the researchers from gaining more insight into their most recent findings (Sedrakyan et al., 2019). On a long-term scale, this issue could produce a number of incorrect visualizations and hurt the outcomes of certain studies where high precision was required.
Proposed Methodology
To attain the aim and objectives of the proposed research project, the author intends to deploy a detailed meta-analysis of the literature on the given subject. Improved insight in data mining and visualization is going to help the author combine findings from more articles into one complex framework where the key issues and opportunities linked to data visualization will be listed and carefully outlined. This research can be expected to help data analysts generate reports of better quality and remove all kinds of conflicting or inconsistent pieces of evidence from the general data set. According to Settanni et al. (2018), a meta-analysis of literature could help the researcher discover new associations between known issues and opportunities. This will improve the outcomes of data analysis and visualization in the future while also increasing the impact of study findings on other researchers. The decision to utilize the meta-analysis methodology was made in order to maintain the inherent effectiveness of literature review methods while attempting to create a clearer picture of how data visualization and data mining are interconnected.
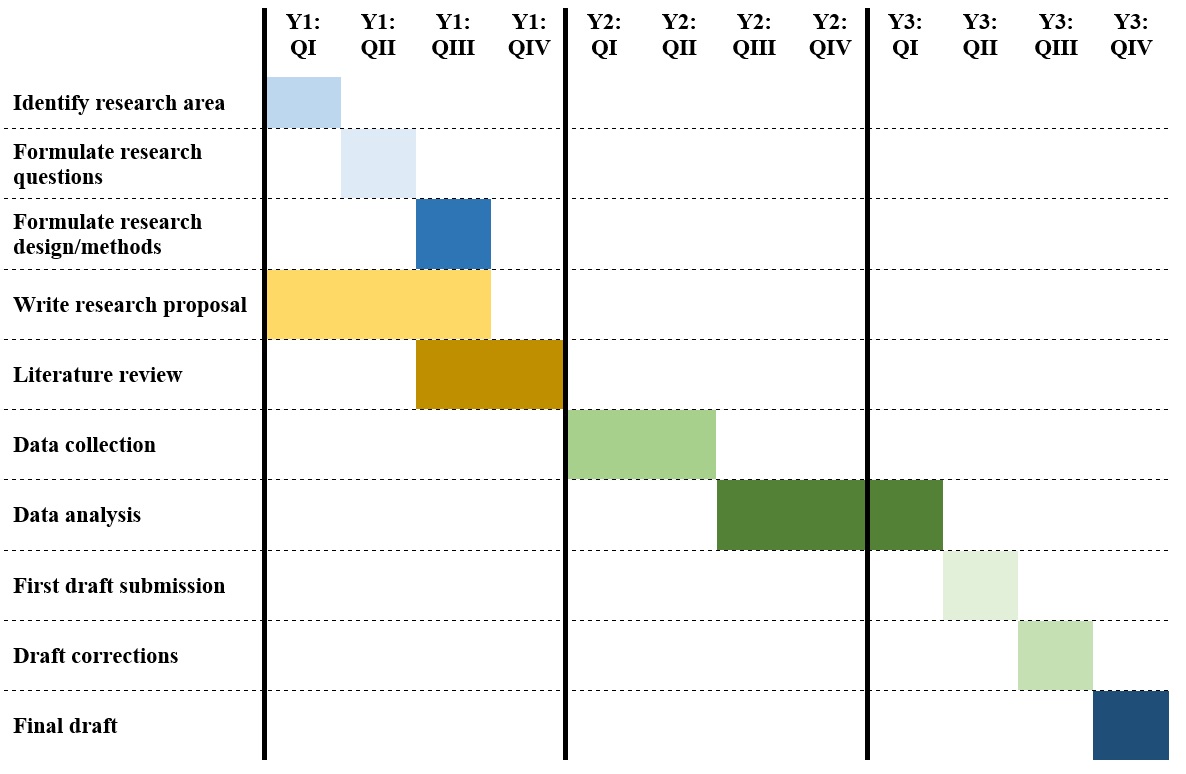
Gantt Chart Schedule
Table 1 represents a possible work schedule for completing the dissertation in accordance with the given proposal.
References
Aldowah, H., Al-Samarraie, H., & Fauzy, W. M. (2019). Educational data mining and learning analytics for 21st century higher education: A review and synthesis. Telematics and Informatics, 37, 13-49.
Bandaru, S., Ng, A. H., & Deb, K. (2017). Data mining methods for knowledge discovery in multi-objective optimization: Part A-Survey. Expert Systems with Applications, 70, 139-159.
Golfarelli, M., & Rizzi, S. (2020). A model-driven approach to automate data visualization in big data analytics. Information Visualization, 19(1), 24-47.
Medvedev, V., Kurasova, O., Bernatavičienė, J., Treigys, P., Marcinkevičius, V., & Dzemyda, G. (2017). A new web-based solution for modelling data mining processes. Simulation Modelling Practice and Theory, 76, 34-46.
Olson, D. L., & Lauhoff, G. (2019). Descriptive data mining. In Descriptive Data Mining (pp. 129-130). Springer.
Pathak, S., & Pathak, S. (2020). Data visualization techniques, model and taxonomy. In Data Visualization and Knowledge Engineering (pp. 249-271). Springer.
Peral, J., Maté, A., & Marco, M. (2017). Application of data mining techniques to identify relevant key performance indicators. Computer Standards & Interfaces, 54, 76-85.
Qin, X., Luo, Y., Tang, N., & Li, G. (2018). Deepeye: An automatic big data visualization framework. Big Data Mining and Analytics, 1(1), 75-82.
Roiger, R. J. (2017). Data mining: A tutorial-based primer. Chapman and Hall/CRC.
Rutkowski, L., Jaworski, M., & Duda, P. (2020). Stream data mining: Algorithms and their probabilistic properties. Springer.
Sedrakyan, G., Mannens, E., & Verbert, K. (2019). Guiding the choice of learning dashboard visualizations: Linking dashboard design and data visualization concepts. Journal of Computer Languages, 50, 19-38.
Settanni, M., Azucar, D., & Marengo, D. (2018). Predicting individual characteristics from digital traces on social media: A meta-analysis. Cyberpsychology, Behavior, and Social Networking, 21(4), 217-228.
Slater, S., Joksimović, S., Kovanovic, V., Baker, R. S., & Gasevic, D. (2017). Tools for educational data mining: A review. Journal of Educational and Behavioral Statistics, 42(1), 85-106.