- Importance of analyzing spatial city sustainability factors
- Example of spatial analysis support system
- GIS as a technology tool to assist in the consolidated practice
- Requirements for good GIS
- Data
- Strong and detailed statistics
- Practices in using GIS software
- Improving collaboration between stakeholders
- References
Importance of analyzing spatial city sustainability factors
Research by Banai (2005, p.4) shows that the use of geospatial data provides a wide range of solutions to the problems encountered by governments in different areas of land and environmental mapping. Some of the critical areas where geospatial data is applied include the mapping of the cities to produce sustainable designs. Governments find the analysis of spatial factors important because they help to ensure adequate provision of land resources for urban development. The information enables effective use of decision-making tools and influences policy-making using geospatial data (Jankowski, Fraley & Pebesma 2014)
It has been shown that a significant number of spatial problems are complex and require the use of complex systems, which use integrated spatial analysis tools and models to create ecological connectivity of different regions of the country. Environmental indicators and other forms of spatial data can be generated to provide data for decision-making (Ferretti & Pomarico 2013).
According to Ferretti and Pomarico (2013, p.34), to support efficient planning, quantitative data is required to ensure effective mapping of multi-habitats and other important areas. Here, spatial data provides solutions for semi-structured spatial problems using different techniques, which are integrated into the GIS system which use Multicriteria Decision Aiding (MCDA) techniques (Jankowski, Fraley & Pebesma 2014).
GIS mapping provides solutions to problems experienced in urban areas, which have experienced leapfrog urban development, poor suburban development processes, and pressure on the local government to provide better urban designs. Spatial data is needed for long-range growth plans for urban sustainable development and plans. The data is used to develop better quality plans for effective city development and management plans. The government uses the geospatial data to anticipate the future growth of the cities and to regulate the use of land to preserve certain features of the land. The use of spatial data enables the government to develop a reliable and effective future development plan, which has the desired growth patterns (Ruiz, Romero, Pérez & Fernández 2012).
According to Ruiz, Romero, Pérez and Fernández (2012, p.45), GIS provides a solution for urban planning by integrating the aspects of zoning, site specifications, and infill management components. The components are used to develop site specification management plans, which are some of the most important factors to consider when using GIS to achieve effective city planning.
Another important factor is the provision of data for spatial micro-level planning, which is essential for the development of urban areas. Spatial data provides the government and urban development authorities with multiple criteria for evaluating mapping activities and multiple evaluation criteria for the graphical representation of data for analytical purposes (Ruiz, Romero, Pérez & Fernández 2012). On the other hand, spatial data provides information about sustainability development by focusing on the use of scores of the land development concept plan to mark and develop the city plan.
Spatial data can be used with certain models which use the tree view perspective definition of sustainable development. The definition consists of weights, which provide the criteria for local weights, which are defined in accordance with the long-term city sustainable development goals. Here, there are long-term, low-density development goals and policies, which influence the type of city development plans and areas to be given development priorities.
The prioritization scheme of what to develop and where such developments take place is based on the weights assigned with the prioritization criteria, which are tuned to the short-term and long-term development goals. Here, the prioritization scheme provides information about vehicular access to pedestrians and other forms of traffic within the city. The model provides a view of the whole city and the sustainability approach to use to develop the city in the long term and the short term. The plan shows the patterns of development and consists of the contiguous arrangement of different features within the city. In addition, it provides information about the best approach to use to organize different features such as pedestrian access, open spaces, woodland, slope ranges, soil types, floodplains, wetlands, and other areas which are considered limitations and potential areas of long term urban sustainability development (Schädlera, Finkela, Bleicherb, Morioa & Grossb 2013).
The analysis of spatial data acts as a precursor to the sustainable development patterns within the city. Information about the distance between residential units provides information about the intersection of the roads and other commercial plots. The entire system provides information for decision-making based on the use of different models and one model is shown below.
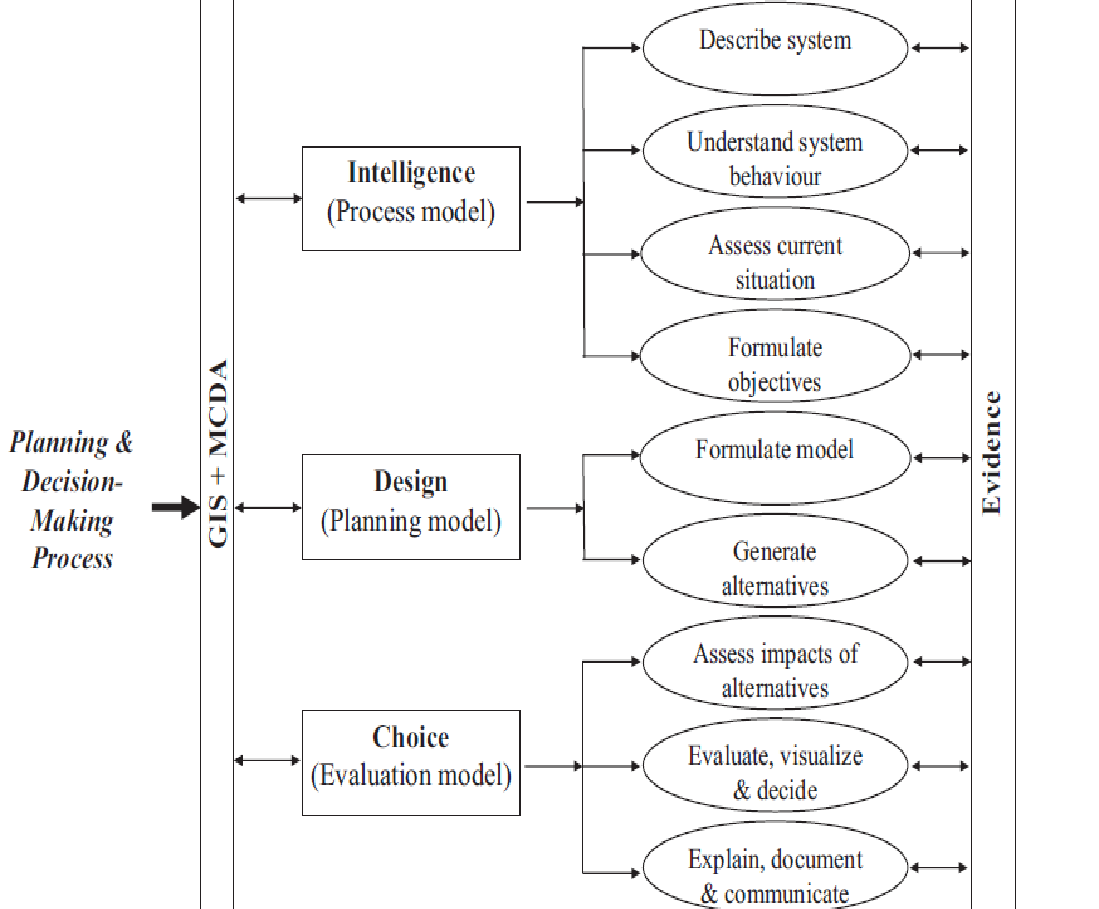
The planning and decision-making elements depend on the use of GIS and MCDA applications. The decision-making framework provides the capability to develop continuous elements for decision-making based on different ecological factors. Here, the need for sustainable development in the cities is emphasized by the use of an ecological network to ensure that critical ecological areas within the city are preserved. The difference between protected and unprotected areas is clearly presented in the ecological map, which is developed using spatial data (Jankowski, Fraley & Pebesma 2014)
Example of spatial analysis support system
Several examples of spatial support systems, which have been used, include the spatial decision support system, which is one of the critical components of the GIS system. It has been used widely in agriculture, resource management, transportation, and healthcare. The underlying rationale is to provide the ability to use spatial data for decision support, which focuses on the use of topological spatial relationships, which underpins the type of decisions to make concerning the geographic characteristics of the region is focused on. Here, the spatial support decision system provides solutions to spatial problems at the operational level (Jankowski, Fraley & Pebesma 2014). The applications use multiple criteria to evaluate the problems and solutions to the problems based on the spatial optimization approach. The use of Boolean combinations to query the GIS application could provide location-specific information. However, the software provides additional criteria for establishing the accuracy of information about a certain location by discriminating among different locations to provide accurate information about the required location. The application uses multi-objective optimization and genetic algorithms, which provide information about facility locations to generate spatial solutions by relying on the use of lexicographic methods and goal programming techniques. The application uses an algorithm based on linear programming components to solve spatial optimization problems. The approach uses linear programming solutions and fuzzy logic rules, and the objective function is to analyze the data in the data store of the application to generate solutions to the problems (Jankowski, Fraley & Pebesma 2014)
The next approach is to use an exploratory approach to solve spatial optimization problems by using what-if capabilities inherent in the system. The capability of the software is based on the use of interactive analysis approaches and yields a number of Pareto-optimal solutions. The model parameters are used to provide the required solutions. The problem-solving approach first uses mathematical optimization techniques, which differ significantly from the Pareto-optimal solutions and provide non- Pareto-optimal solutions. The overall picture is to provide accurate information on the location of a specific object in a given area (Jankowski, Fraley & Pebesma, 2014).
Another capability that is critical for the system, which could provide the required benefit to the GIS system, is the generation of non-denominated solutions. Here, the application uses the genetic sorting algorithm, which is based on the probability of fuzzy operators such as mutations and crossovers. The important elements here are fuzzy operators and the probability of certain occurrences, which provide two solutions. The two solutions are characterized by the spatial diversity of the population and the objective function values of the solutions. Once adopted into the geographical information system, the system generates a wide range of solutions to a wide range of problems. The solutions to the spatial problems vary according to the metric values of the solutions, which are based on different mathematical calculations. Here, there are global measures, which can be used to define the location of a point on land based on the spatial structure of the elements of the population, which provide the required solutions. In addition, the similarities of the points in a given population in the structure provide the required information about the location of the points in the diversely dispersed area. Here, the use of fuzzy logic allows for the use of spatial diversity metrics to generate the required information about a specific location (Jankowski, Fraley & Pebesma, 2014).
Another example, which provides the capabilities to make decisions, is the Spatial Analysis and Decision Assistance (SADA). The application has widely been used in making environmental remediation using different modules which have been integrated into a single application. The capabilities of the software are in providing the visualization component using spatial data analysis algorithms. The application provides the environmental modeling and site assessment capacities using the environmental assessment toolkit. In addition, the software provides an interactive face, which allows the user to navigate through the entire application with a lot of ease. The sample design framework is shown in the diagram below.
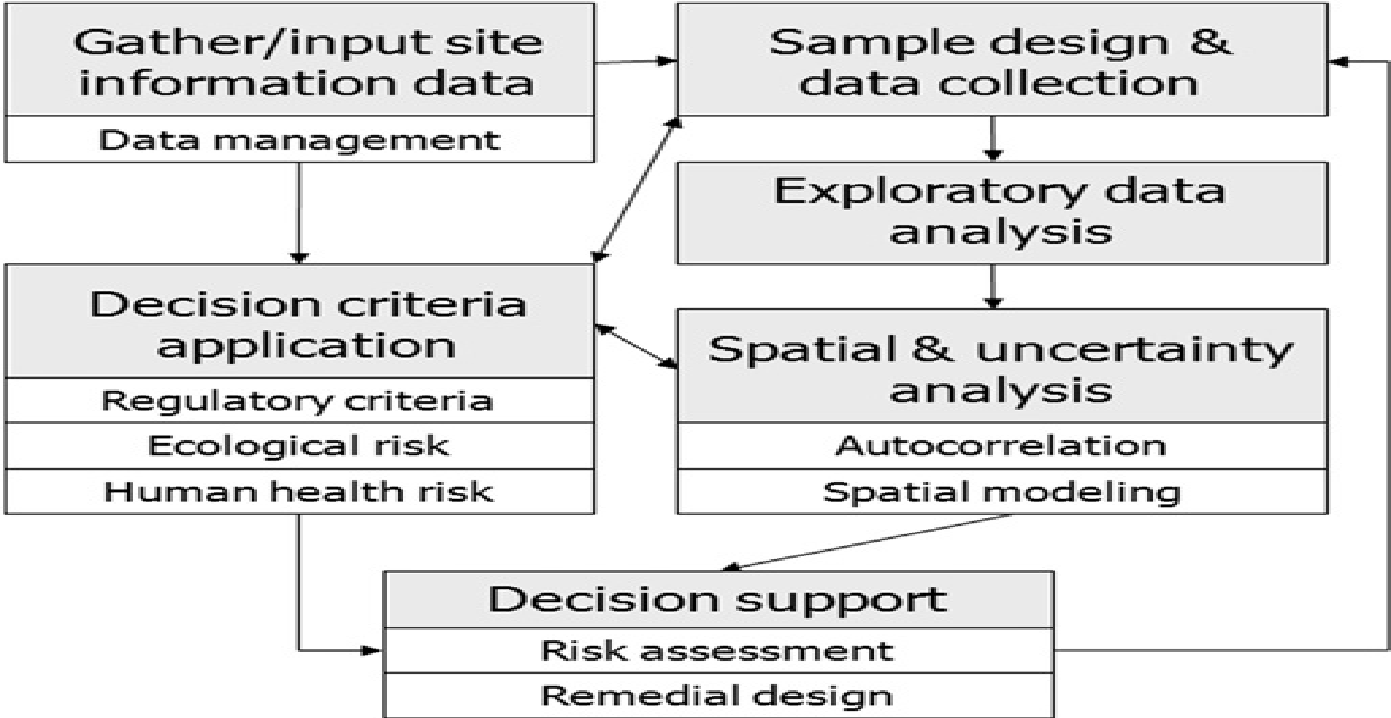
The diagram above provides the navigational capabilities by enabling the user to easily enter data into the system after the data has been collected. The system allows the application to run samples of the test data to provide an output in graphical form which can be used to make analytical decisions
It is important to note that when using the system, the sample data used to run the program must be preprocessed and modified to enable the system to handle large amounts of data. It has important capabilities, which include the ability to provide gridded data, which is in an appropriate format that can be used in GIS. In addition, the application has additional functionalities, which include the ability to import two-dimensional and three-dimensional data formats. Other formats which can be imported include the Data exchange Format, photographic images, and shapefiles (.shp) files.
A number of advantages associated with the use of SADA include the ability to set up the site of interest using the software, the ability to provide an accurate description of the site including the horizontal and vertical boundaries of different layers of land. Other elements include the ability to provide spatial correlation capabilities. Spatial autocorrelation is a functionality, which provides GIS with the capability to provide the data autocorrelation services. SADA integrates standard tools, which include the standard semivariogram plots, standard correlation models, variogram maps, and various other data management and analysis tools (Schädlera, Finkela, Bleicherb, Morioa & Grossb 2013).
GIS provides spatial correlation solutions because of the autocorrelation component, to implement geospatial models. SADA provides the ability to conduct an assessment of spatial data using deterministic methods to generate the actual estimate of a single point. The application supports the use of deterministic methods to build geostatistical models, which provide the ability to estimate the distribution function of each node in an area being mapped. The application has the capabilities, which include modules drawing representative values to use for mapping purposes (Jankowski, Fraley & Pebesma 2014). In addition, SADA provides the application with the ability to conduct statistical analysis and assess the risk associated with user-generated decision-making criteria. Here, sufficient data has to be made available to ensure the site to be investigated has been represented adequately. When sufficient data is made available, it becomes easy to create a correlation structure or estimate to create a meaningful model. The data processing model is detailed in the diagram below.
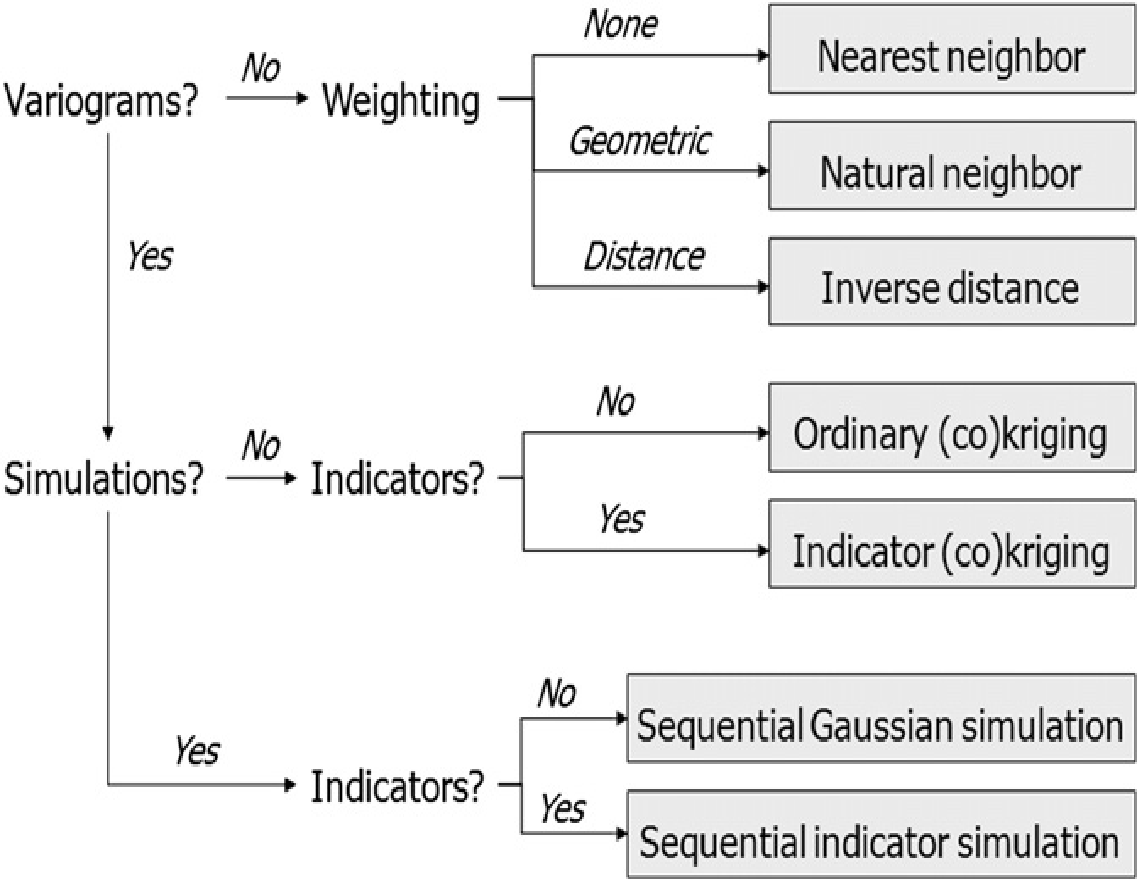
The diagram shows the decisions tree, which is one of the components that provide spatial interpolation capabilities. The decision tree spans simple waiting schemes and the appropriate implementation of the variograms for simulation purposes. In the context of the above simulation diagram, the option on what to do and alternative solutions are shown.
Another example of the spatial decisions that have been applied is in the reallocation of land in Turkey. The underlying model for solving the spatial problems related to the reallocation of land was based on the use of the Spatial Decision Support System (SDSS).
GIS as a technology tool to assist in the consolidated practice
The geographical information system (GIS) has proven to be a technology of choice, which can be used to solve spatial problems in decision making. The use of GIS in decision-making is made possible because the system uses the required hardware and software, which have data capturing capabilities to manage, analyze and precisely display the captured geographical information. The system is defined by statistical data analysis and management modules, three-dimensional spatial visualization capabilities, and risk assessment capabilities to provide effective data analysis capabilities for decision making (Ferretti & Pomaricos 2013). The entire process is aggregated into a decision support system (DSS), which underpins the performance of the geographical information system (GIS). Relevant data must be captured to enable the software to use its capabilities to analyze the data and generate relevant data in graphical form for decision making. The GIS system consists of software modules with decision-making capabilities, which have interactive capabilities. The right decisions can be made to solve the spatial problems, which are based on spatial decisions by use of a large number of data with a large number of alternatives (Ferretti & Pomaricos 2013).
GIS provides the basis for solving spatial problems, which are complex and demands detailed analysis because of the level of complexity of the data, to avoid the use of poorly defined and semi-structured data. GIS can be used to solve spatial problems by using spatial data, which have been identified and localized with specialized attributes. The attributes make the spatial solutions easy because they define the type and characteristics of the inputs, and are able to provide solutions to the current state using different layers. In addition, the output is in the form of charts, maps, and layers and the application can be used to provide analytical data for future use (Pomarico & Ferretti 2013).
Requirements for good GIS
The level of accuracy of the GIS application depends on the source of data, how the data is encoded, and the modules used for data analysis. The type of data encoding schemes defies the accuracy of imagery and digital data generated by the GIS application. The application is defined by the use of different types of modules, which provide different capabilities to process the data to solve spatial problems accurately.
A good GIS should provide the technical capability to make accurate decisions using different types of modules for decision-making based on spatial analytic techniques. The application has to provide the capabilities to enable spatial autocorrelation of data using location as the key index variable. GIS should have the capability to spatially locate and relate data to different objects and provide the detailed location of the objects. The system should be defined by the required functionalities and be integral to a number of features such as the Geospatial Web and Semantic Web, which allows other software agents to read its contents. In addition, GIS should provide the required functionalities in the form of service-oriented architecture, Geotagging and GeoRSS capabilities to enable the system to provide the flexibility which allows for the application to support the provision of mapping and location-based services. Literature in a good GIS should integrate sensor web capabilities, which allows the application to provide real-time data processing capabilities. The system should allow for the flexibility to build communities to share the geospatial data for the express purpose of developing mashups and geospatial applications (Halbich & Vostrovský 2011).
Data
Data representation in GIS provides a simplified method of representing features of the earth in digital form. The organization of data in a GIS container can be in spatial objects or thematic layers (Halbich & Vostrovský 2011). An appropriate data model is used to store thematic data depending on the potential use of the data and where it is to be used. There are different types of geospatial data models, which include the georeferenced data model, vector data model, and the Rasta data model. The georeferenced data model is defined by a spatial component, which provides detailed information about the distribution of certain features. The features can be land demarcations or other natural features. The GIS application should allow data to be represented in the form of fixed representations, use of geometrical objects, which include natural features, which use coordinates. The use of the technique allows for the use of the vector data model (Halbich & Vostrovský 2011).
The Rasta data model allows users to use the grid points, which are represented in a continuous matrix of values, which provides detailed information about the temperature, chemical concentration, and other chemical and physical features in the area being mapped (Ferretti & Pomaricos 2013). A good GIS system must allow for the representation of images in the form of scanned maps, satellite images, and converted vector maps using the grid points in the system. In addition, a GIS tool helps to achieve the representation of data in the form of vectors using the vector data model. The vector data model provided the flexibility of representing areas, points, and lines. Typically, they constitute arc nodes, which do not form intersections at any points within the area that has been marked. Typically, the entire system of arcs, segments, centroid points, provides good coordinate information that describes the data topology and the position of objects relative to the ground.
GIS software should support the data model transformations, which occur between the Rasta and vector models, among other models for use to map out different features. It should also support the two and 3D dimensions of data. The system should allow for the projection of geospatial data to flat or two-dimensional surfaces.
GIS is a tool that provides the flexibility to be implemented as a multipurpose system in different forms such as providing the features of a subsystem of a larger software package to handle geospatial data. GIS is geostatistical analysis software for hydrologic modeling. GIS allows for the integration of data from different sources. It is possible to present the data in digital form by creating digital copies of maps (Schädlera, Finkela, Bleicherb, Morioa & Grossb 2013).
Strong and detailed statistics
GIS supports different features which make it appropriate for use in the analysis of spatial data. GIS supports the capabilities to analyze spatial data based on the use of the statistical features inherent in the software. The data to be analyzed is classified into an event or point patterns, which are defined by point processes and include crime scenes in an urban setting, contiguous surface, which describes ecological, topographical, and geological data. In addition, the areas with aggregate rates, which are associated with population surveys, health statistics, and census surveys, constitute the type of data used to provide evidence of the prevalence of certain features in certain locations (Ferretti & Pomaricos 2013).
Different methods have been used to provide capabilities for statistical data analysis using GIS. One of the approaches is to use the proximal theme. The theme provides the ability to develop the dependence structure of the spatial datasets. In addition, the attributes of each spatial data are required and their relationship stored in a particular way to provide the statistical proximity of a point. In addition, the data has to be characterized by the use of spatial dependence and heterogeneity descriptors. It is important to note that the value of dependence, which is used for statistical purposes, can be used for point location purposes. The variance of the data used to represent homogenous situations can be determined by the values of the standard deviation and the mean of the population (α2 and the µ respectively). Here, the difference in the mean and standard deviation with other sources of spatial data provides the description of the circumstances on the ground. Here, there are four types of spatial patterns, which emerge. These include heterogeneous patterns, spatial patterns, heterogeneity caused by spatial trends, extreme variance, and stochastic processes, which are caused by random fluctuations of the population. Here, the data is stored in different ways, which is in terms of a number of measures consisting of the d values (where d the value is the distance of the randomly distributed distance using the standard deviation). The statistical data is stored in pixel form in a relatively homogeneous way. Other cases where data is used include the Poisson distribution in binomial cases and the normal case (Ferretti & Pomaricos 2013).
Practices in using GIS software
Research has shown that GIS software has been widely used in different areas. One of the areas includes urban and regional planning. The best practice of using GIS includes a commitment to long-term use based on comprehensive needs assessment information. In addition, there should be partnerships and collaboration, use of accurate estimates for running GIS, compliance to geographic standards, infrastructure documentation, ease of installation, LAN configuration, and widespread availability of data.
Improving collaboration between stakeholders
The collaboration efforts occur between commercial stakeholders. The sources of data for collaboration include the GDT, which is used to supply GI to various players in the industry with geospatial data. In addition, the use of GIS has led to the creation and development of different partnerships and among different industry players and stakeholders. That has led to commercial partnerships with different companies such as Google and Nokia. Typically, the companies have bought other technologies, which have been integrated with GIS to enhance collaboration between different companies. In addition, the companies have made various acquisitions, which include the Open Geospatial Consortium, which provided open public-private partnerships, which has more than 400 members all over the world. In addition, global forums for collaboration have been established, which provide the platform for global collaborations on the use of geospatial data. It has become possible to provide free geospatial data services based on openly available standards for sharing geospatial data (Ferretti & Pomaricos 2013).
Another area of collaboration, which makes the work easy, is in the provision of infrastructure development services, which supports the provision of free geospatial data on the internet. The provision of free geospatial data is based on the SDI model, which is driven by data providers and users and provides scope for adding data to the applications at the lowest level, which is the local level. Here, social networks play a significant role in the provision of geospatial services based on proprietary and open-source software.
One of the applications used to provide the required services includes the ESRI software, which provides services for system developers to assemble different modules for use in the provision of geospatial services to solve spatial problems. In conclusion, GIS is an application that has been used to create value for human life and to address typical problems that affect human families. The solutions to human problems include enabling governments to create sustainability planning for urban areas and cities to achieve long-term planning goals (Ferretti & Pomaricos 2013).
References
Banai, R 2005, ‘Land Resource Sustainability for Urban Development: Spatial Decision Support System Prototype’, Environmental Management, vol. 36, no. 2, pp. 282–296.
Jankowski, P, Fraley, G & Pebesma, E 2014, ‘An exploratory approach to spatial decision support, Computers’, Environment and Urban Systems, vol. 45, no. 2, pp. 101–113.
Ferretti, V & Pomarico, S 2013, ‘Ecological land suitability analysis through spatial indicators: An application of the Analytic Network Process technique and Ordered.
Weighted Average approach’, Ecological Indicators, vol.34, no. 3, pp. 507– 519.
Ruiz, MC, Romero, E, Pérez, MA, & Fernández, I 2012, ‘Development and application of a multi-criteria spatial decision support system for planning sustainable industrial areas in Northern Spain’, Automation in Construction, vol. 22, no. 2, pp. 320–333.
Schädlera, S, Finkela, M, Bleicherb, A, Morioa, M & Grossb, M 2013, ‘Spatially explicit computation of sustainability indicator values for the automated assessment of land-use options’, Landscape and Urban Planning, vol. 111, no. 1, pp. 34– 45.
Halbich, C & Vostrovský, V 2011, GIS as spatial decision support system Agris on-line Papers in Economics and Informatics, vol 3, no. 2, pp. 122-160.