Abstract
A gas is one of the three states of matter whose particles are separated by vast distances. Several laws attempt to justify the behavior of gases under varying conditions. Charles’s law illustrates gases’ behavior under varying volumes and temperatures at uniform pressures. Conversely, Boyle’s law demonstrates gas behavior at changing pressures and volumes at uniform temperatures. This practice is aimed at validating these two gas laws and establishing absolute zero temperature. It was realized that the two gas laws applied to the air samples. Nonetheless, there were differences in the published and experimental values of the absolute zero temperature due to experimental errors.
Introduction
There are three basic states of matter, which are solid, liquid, and gas. In gases, the molecules (or atoms) contain very large spaces between adjacent molecules. Gases can contract and inflate easily, and for this reason, they do not have specific forms or volumes. Consequently, gases assume the outline of containers that hold them. In addition, gases are extremely compressible because the large spaces between adjacent molecules allow them to get close to each other as much as possible.
In the eighteenth century, scientists discovered that most gases acted in a similar way when subjected to different temperatures and pressures. The wide spacing between gas molecules was the reason behind the observed behavior. Boyle noted that keeping gas at a constant temperature while adjusting the pressure altered the volume of the gas. That observation was later called Boyle’s law, which still applies to all gases at present. The equation P×V=k illustrates Boyle’s law. In this equation, P denotes the gas pressure. V denotes the volume of gas and k is a constant.
Another scientist called Charles realized that lowering the temperature of a s whilst the temperature was maintained steadily decreased the volume of the gas. The equation V/T = k explains Charles’s law. In this equation, V stands for the gas volume. T is the temperature of the gas while k represents a constant.
It was also noted that simultaneously lowering the temperature and compressing allowed the gas to undergo indefinite compression. Theoretically, it was proposed a gas could undergo compression until its volume reached zero. The temperature at which the gas reached zero volume was called the absolute zero of temperature. The absolute zero was the same as -273 oC or -469.67 oF (Encyclopedia Britannica para. 1).
This experiment expected to verify Charles’s law and Boyle’s law on air. It also intended to estimate the value of the absolute zero by extrapolating the plot of volume against temperature.
Experimental Procedure
Charles’s Law
A long disposable pipette was used to slot a glycerin plug of approximate length 2 to 3 cm into a blood serum sample tube. The setup was used as the sample tube in the experiment. The volumes of the gas column in the sample tube were determined at four different temperatures beginning with the lowest temperature (oC) and ending with the highest temperature. The gas volumes were read from the capillary tube within two to three seconds of putting the tube in the water-baths.
The first water-bath had ice at a temperature of 0oC, whereas the second water-bath held water at room temperature. The third water-bath, in contrast, had warm water at temperatures between 60 and 70 oC (Grossie and Underwood 108). The last water-bath contained hot water. The total water volume in all the water-baths was 150 ml. The specified temperatures were maintained by heating or cooling the water as was required.
The temperatures and gas heights at various conditions were recorded after which a plot of length (cm) against temperature (oC) was made. The plot was used to approximate the absolute zero value in oC and oF.
Boyle’s Law
To find out the connection between the pressure and volume of a gas, a previously arranged burette and reservoir were used. An air sample was shut in the burette (at the pressure of the atmosphere). The pressure that was exerted on the air was controlled by varying the height of the attached reservoir. The water heights in the burette and reservoir were measured and tabulated. The height of the gas in the burette denoted volume while the pressure related to variations in water levels. All values were recorded.
The gas pressure (P gas) and gas volume (V gas) were worked out and recorded. A plot of P gas versus the reciprocal of gas volume (1/V gas) was made.
Data and Results
Charles’s Law
Table 1: Charles’s Law.
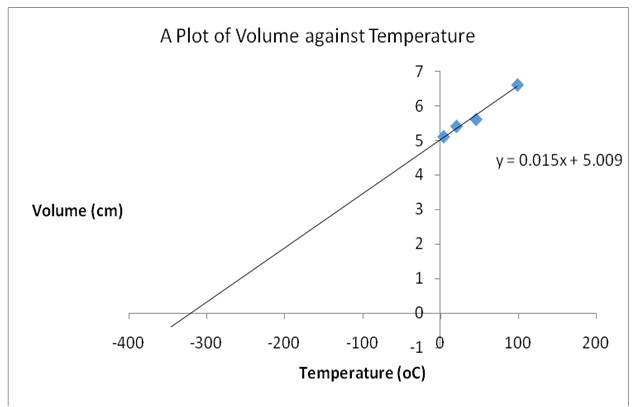
Plot of Volume versus Temperature
Calculated Quotient of V/T
Table 2: The computed quotients of volume and temperature.
Absolute Zero Determination in °C and °F.
The absolute zero was -333.93 oC as indicated by extrapolation of the plot. The value was obtained by substituting y with 0 in the equation of the plot (y=0.015+5.009). To convert the temperature from oC to oF, the following equation was used.
oF= 9/5(oC) + 32
oF= 9/5(-333.93) +32
oF= -569.074.
Boyle’s Law
Table 3: Boyle’s law.
Calculated Product of PV
Table 4: The calculated products of volume and pressure.
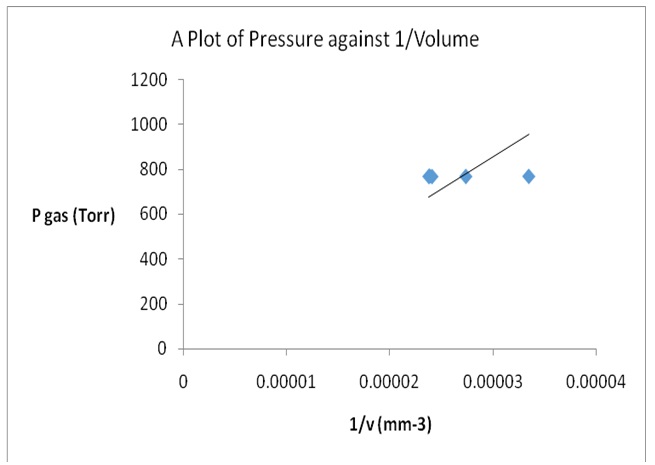
A Plot of Pressure versus Inverse of Volume
Discussion
There were no substantial differences in the quotients of V/T indicating that Charles’s law applied to the gas probably because measurements were accurately obtained. However, there were significant variations in the values of the products of pressure and volume especially at the highest and mid pressures. That was because Boyle’s law did not apply to the gas at those points probably due to experimental errors.
Charles’s law was verified because a straight-line graph was obtained indicating that indeed gas volume increased steadily with an increase in temperature at a constant pressure. Boyle’s law was also demonstrated because a straight-line plot was achieved when pressure was plotted against the reciprocal of volume indicating an inverse connection between volume and the pressure of a gas.
The absolute zero value obtained (-333.93 oC or -569.074 oF) was higher than the literature values of -273 oC or -469.67 oF. Experimental errors possibly led to the differences in the values. It was possible that the sample tube leaked thereby altering the pressure. It was also possible that the tube overstayed in the water-baths thereby affecting the temperatures.
References
Encyclopedia Britannica. n.d. Absolute Zero (Temperature). n.d. Web.
Grossie, A David and Kirby Underwood. Laboratory Guide for Chemistry. 6th ed. 2013. Plymouth, MI: Hayden-McNeil. Print.