Introduction
In the present laboratory work, the nature of the relationship between the force applied to the smartcart and the acceleration, as well as between the acceleration and the mass of the cart, was evaluated. For this purpose, two different experiments were performed: in the first, the mass of the weights suspended from the pulley was changed, and by this change, the effect of the force on the acceleration was evaluated. In the second experiment, the force was constant, and the mass of the cart was changed, which affected the acceleration.
Analysis
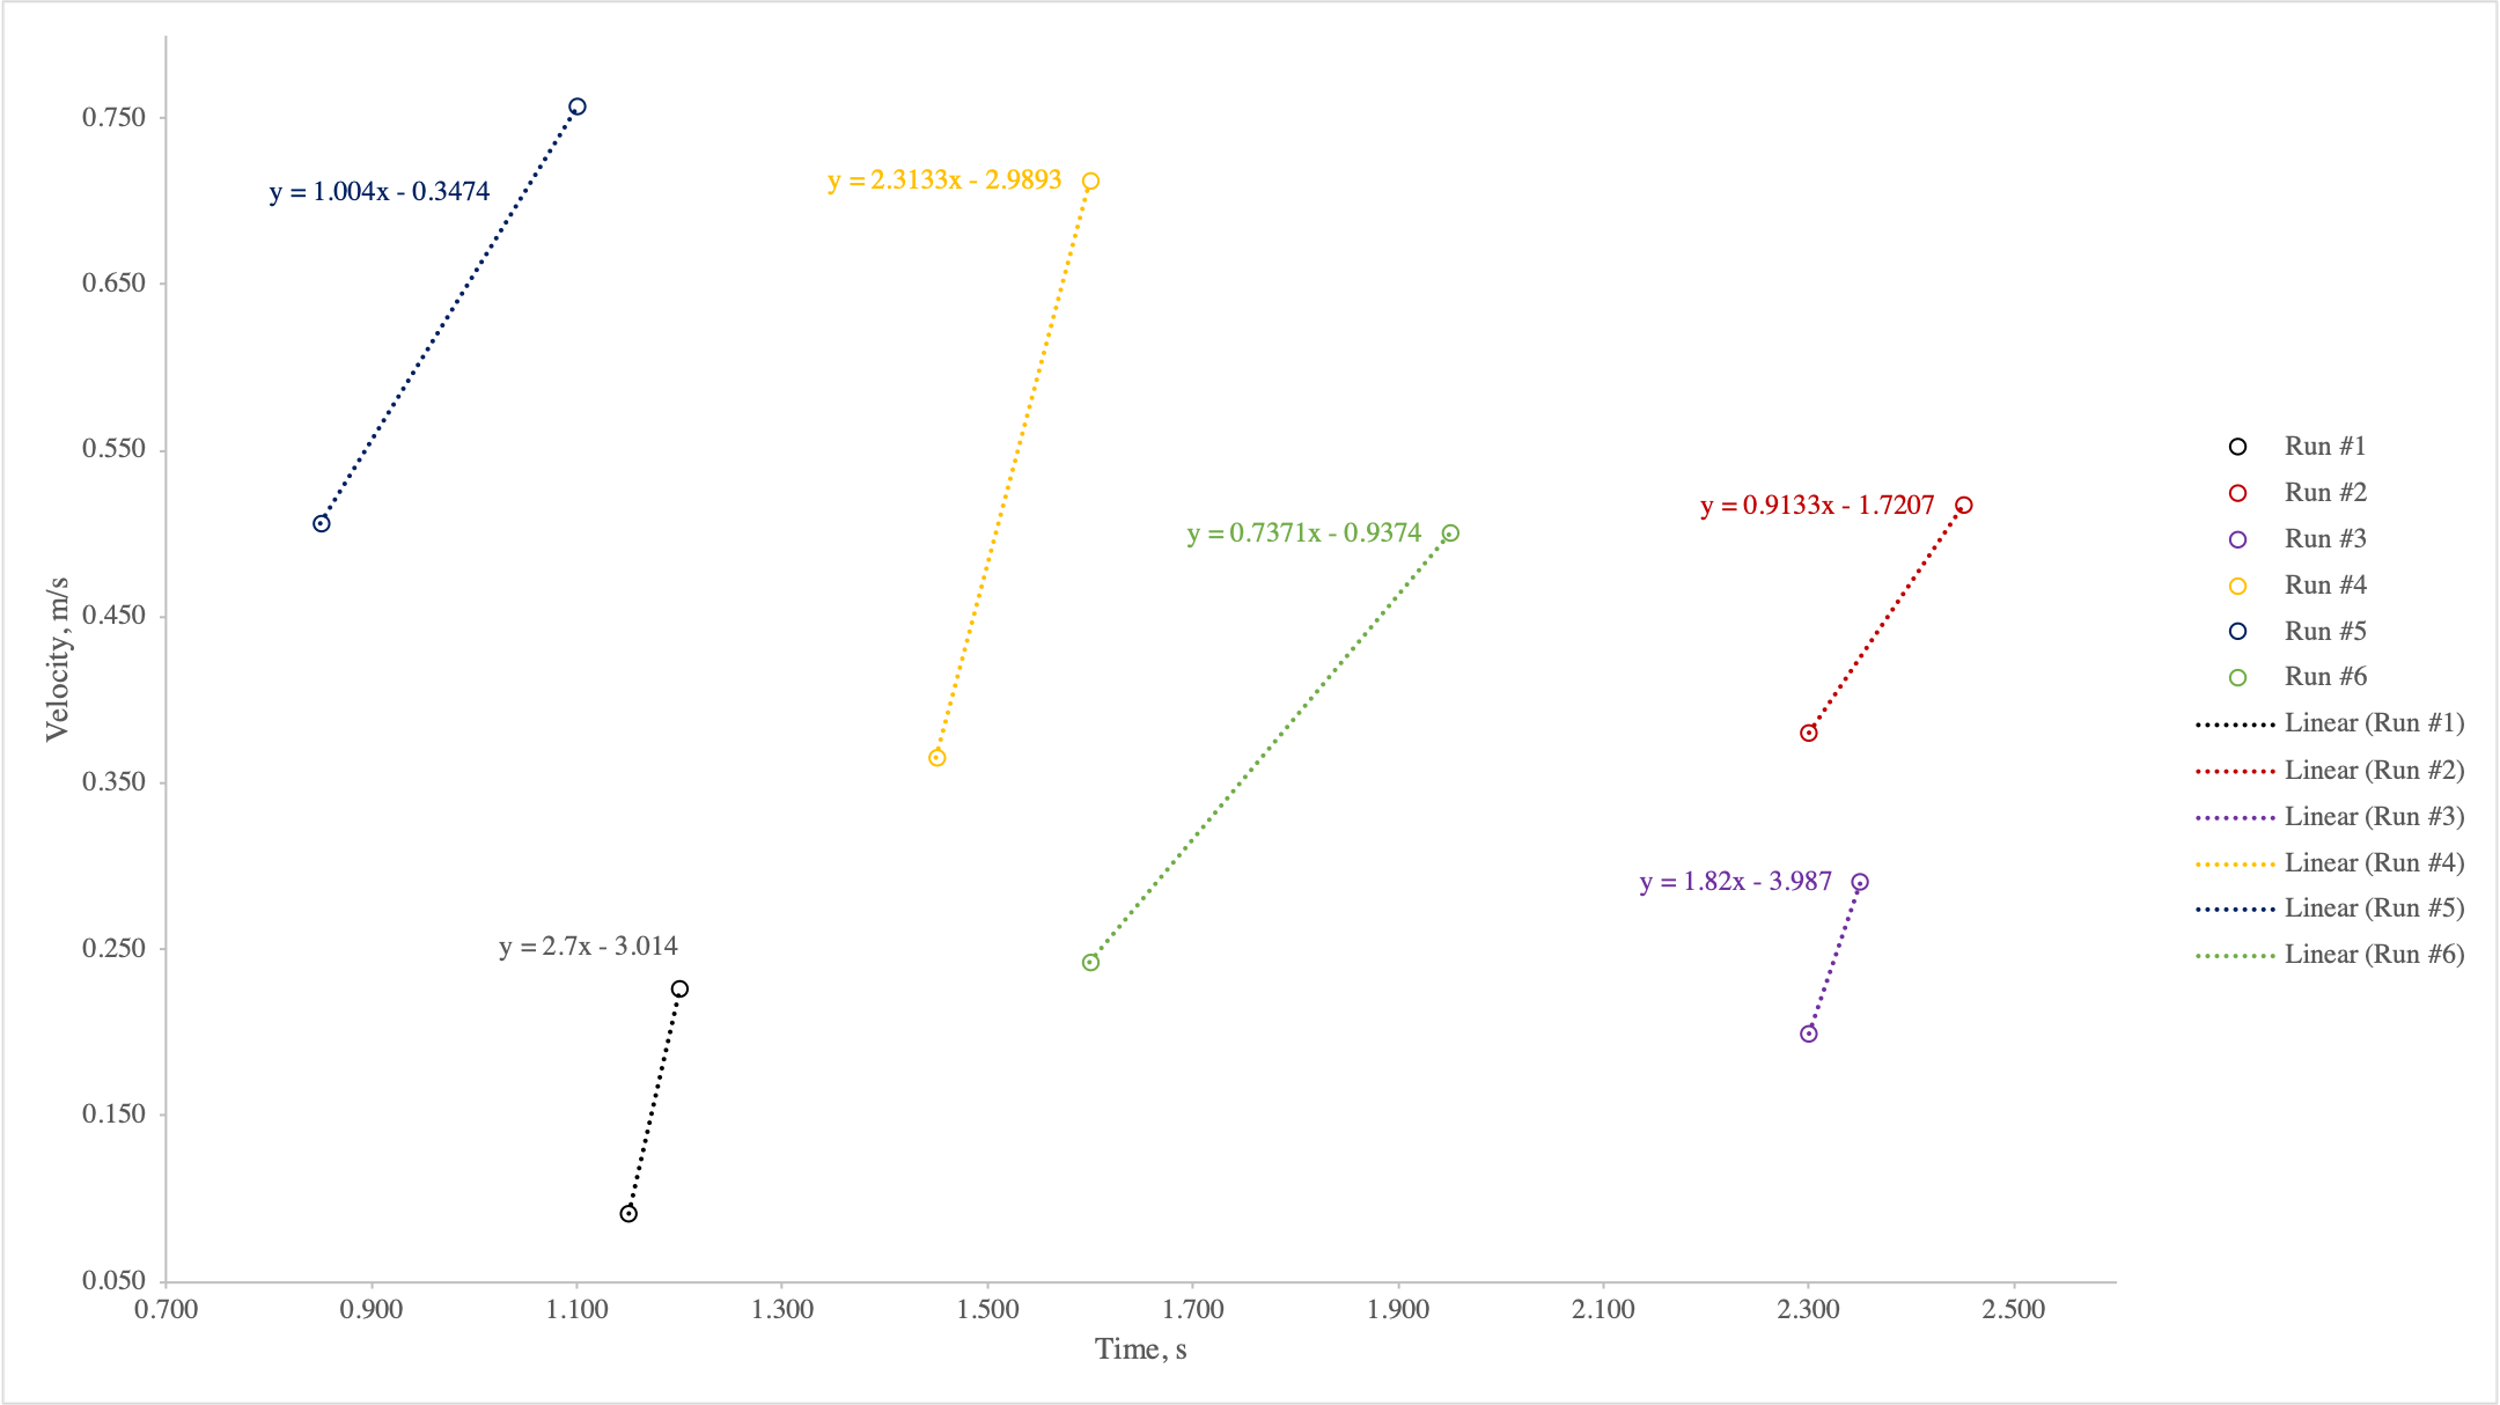
During the laboratory measurements, data for velocities (two measurements) and times (two measurements) in six tests were initially obtained. For each test, velocity-time plots were plotted to determine the six values of acceleration affecting the cart. More precisely, the slope of the regression line for each linear approximation was defined as the acceleration measured in m/s2; the corresponding plots are shown in Figure 1.
Table 1: Raw data obtained for velocity and time measurements
As seen in Figure 1 below, the acceleration for each test was different and ranged from 0.74 m/s2 to 2.70 m/s2, which is determined by the intensity of the slope of the straight line. Since only two points were used for each test, the coefficient of determination (R2) was calculated as 1.00, which indicates the high accuracy of the regression model; in fact, it is known from geometry that two points always form a straight line, so the maximum value of the coefficient of determination does not seem illogical. The difference in acceleration was not surprising since each test used a different mass of cargo, which affected the speed and, therefore, the acceleration of the smart cart.
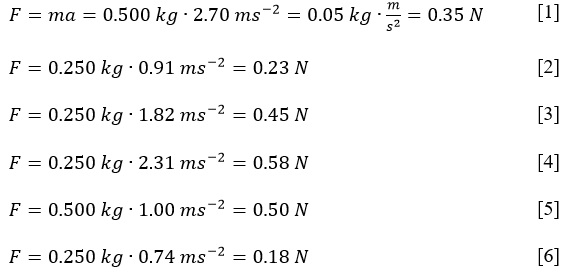
The weights for the weights affecting all six carts were different and are shown in Table 2. The values of the masses, expressed in kilograms, can be used to calculate the force that affects the cart. This uses Newton’s second law, which postulates that the geometric sum of the forces acting on an object is equal to the product of the object’s mass by its acceleration, that is, F = ma (CK-12, 2019). Equations [1]-[6] show the calculations used to calculate the forces in each test. The values of the calculated forces were expected to be different for each test and ranged from 0.18 N to 1.35 N, depending on the weight. When the weight mass was 250 g, the average value of the force applied to the cart was 0.36 N, and for a mass of 500 g, the average velocity was calculated to be 0.93 N. The increase in the value of the force as the mass increases is entirely consistent with the statement of Newton’s second law.
Table 2: Masses of loads applied through the pulley and affecting the acceleration of the cart.
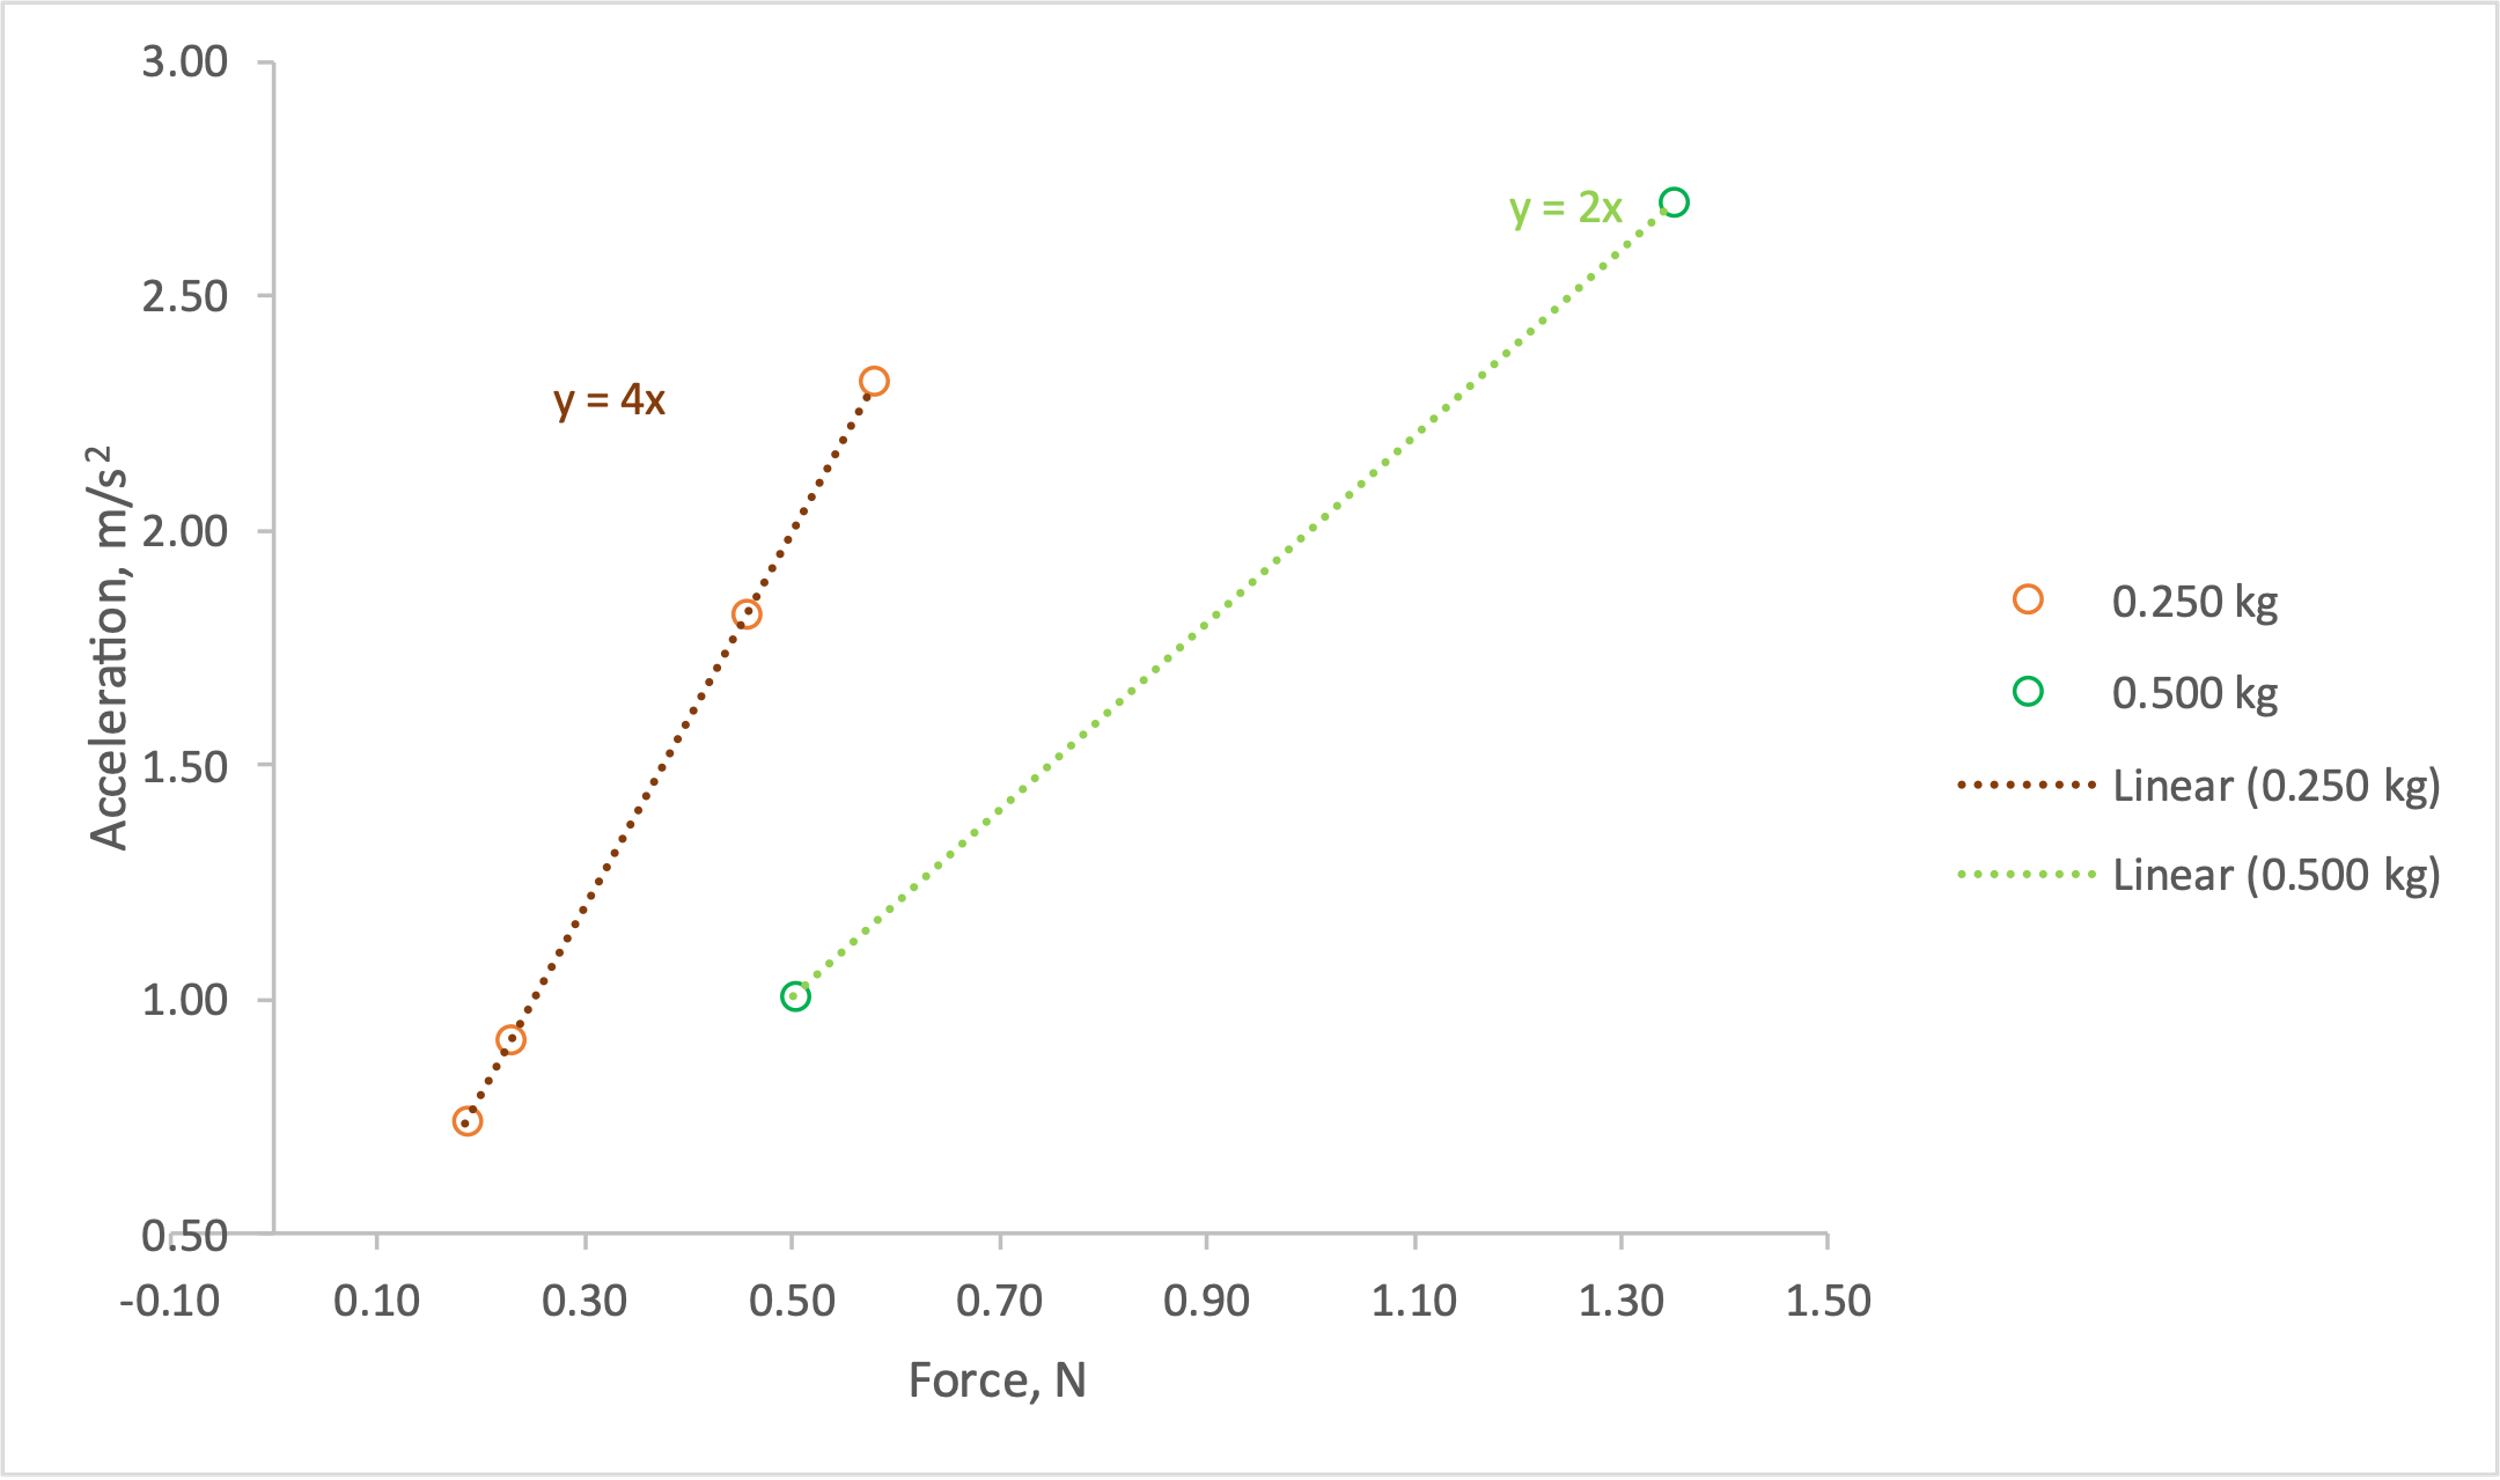
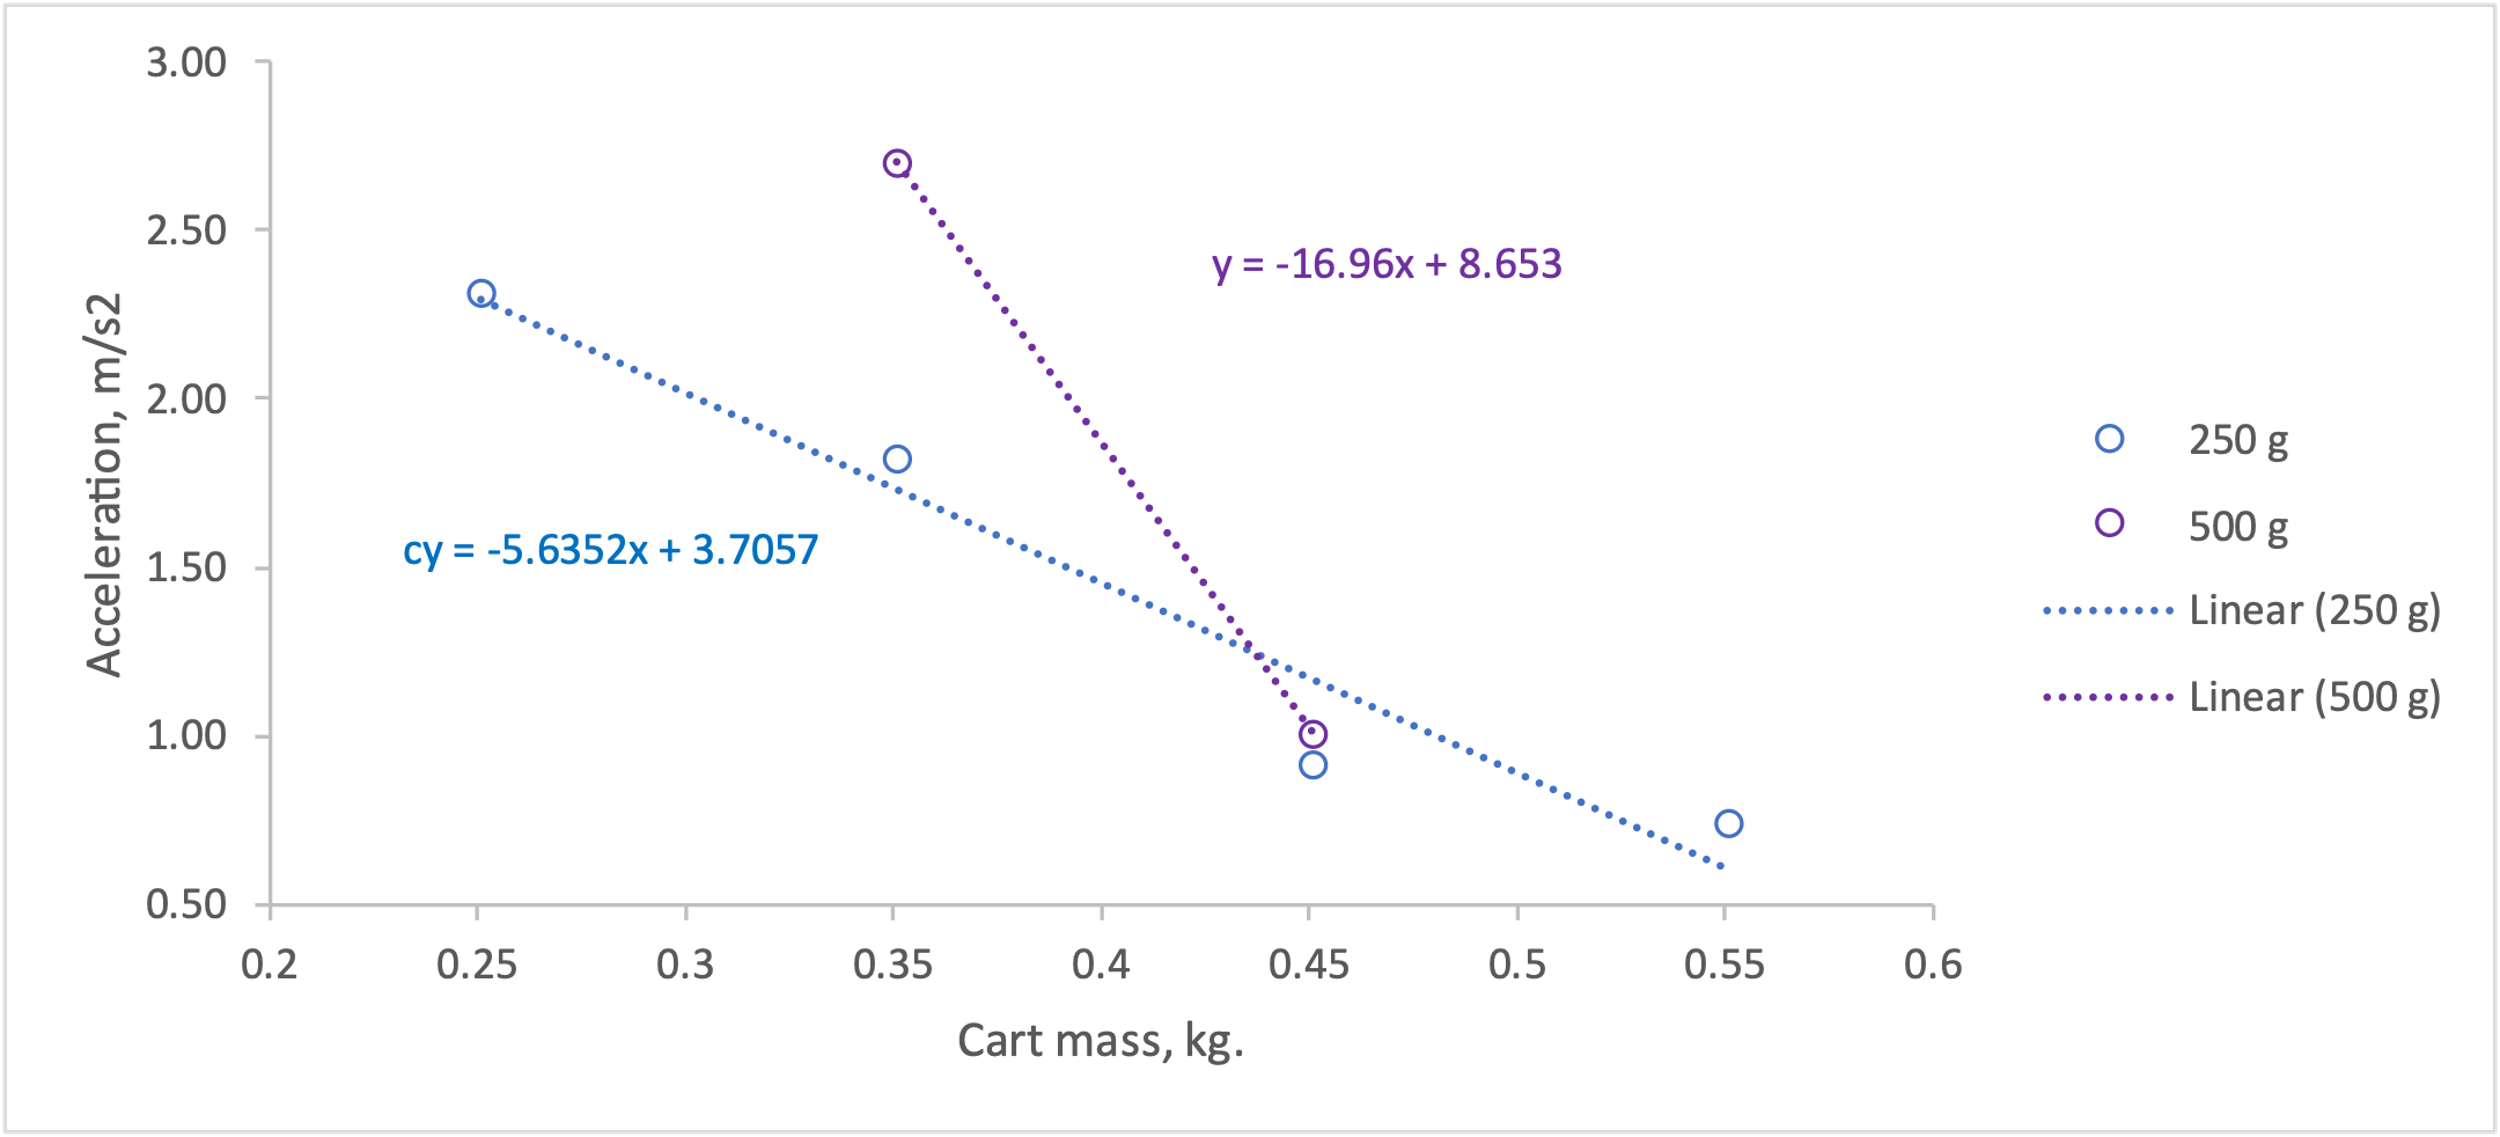
From the data obtained, plots of acceleration against the applied force as well as acceleration against mass were plotted. Figure 2 shows the linear relationship of acceleration versus applied force for two different weights, from 250 g to 500 g; in this case, the weight of the cart was constant. It is noteworthy that a linear relationship between the variables was determined, which implies that acceleration increases linearly with increasing applied force, and vice versa — this confirms Newton’s second law. The inverse of the slopes makes physical sense and is numerically equal to the mass of the weights applied to the smart cart. Figure 3 shows the dependence of acceleration on the mass of the cart: in this case the applied force did not change, that is, the mass of weights was constant for all measurements, while the mass of the cart changed in increments of 100 g. The linear relationship was also confirmed in this case, but the trend was downward. This means that when the mass of the cart increased, the acceleration decreased, which also follows from Newton’s second law, since mass and acceleration are related by inverse proportionality.
Conclusion
To summarize, a linear relationship between the variables was confirmed. It was confirmed that acceleration was linearly related to the applied force, and the cart’s mass was linearly related to the acceleration. At the same time, the trends were opposite, which is entirely consistent with Newton’s second law of motion.
Reference
CK-12. (2019). 11.3 Newton’s Second Law. CK-12.