Over the past fifty years, a range of policies have been formulated to address the ever-deteriorating educational standards of schools in the United States (Ravenscroft 453). Critical among them has been the measures aimed at increasing public spending on education (Mishra 6). Regardless, however, the levels of socio-economic growth, in respect of the entire American workforce, have not been as significant (Ravenscroft 453). In the end, as an element of education-change-management measure, many researchers have suggested that the strategy should be embraced to create many graduates who are better equipped for gainful employment and higher education (Garces and Currie 999).
However, what has clearly emerged is that actions aimed at improving student enrolment rates and college ‘‘turnouts’’ have not always produced the desired levels of economic productivity and growth (Mishra 9). In spite of this acclaimed opinion, many recent and past researches indicate that there is a relationship between improved public spending on education and student enrolment rates in the United States (Garces and Currie 999). According to Edward John, the revelations in most studies show a close relationship between a state’s economic development and its residents’ accessibility to education and meaningful employment (9). Just as important, also, many researches indicate that there is a major link between the kind of education offered in different American states and the amount of resources allocated for educational purposes (Garces and Currie 999).
In a sense, the policy that advocates for an increase in public spending in schools have led to better productivity of workers and improved rates of economic growth. However, the number of skilled workers relative to the respective states’ population has not improved as expected (John 17). Over the years, the number of ‘‘returns’’ for graduates, in comparison to school drop-outs, have increased. Previously, such a development led to a rise in the number of students enrolling in schools because many people wanted to acquire skills to improve their earnings in their states (John 18).
Other than college attendance rates, this research paper focuses on the relationship between public spending and high school graduation. In attempting to underscore the economic importance of increased public spending in education, the paper compares different research data in fifty American states over the last five decades. The paper recognizes the often-mentioned American notion that a country’s source of wealth is in the skills possessed by its citizens (Garces and Currie 999). To achieve a balanced analysis, the paper focuses on different pieces of information gathered in fifty states across the country over the last 50 years. In some instances, specific data on particular states is provided. Where necessary, an average of such data is compiled to meet the demands of the study’s main objective.
An Overview/Summary of the Investigation
The increase in the number and quality of United States’ human capital remains among the most significant indicators of economic development and productivity (Cameiro and Heckman 705). In many respects, the quality of the American human resource growth has either increased or stagnated depending on which 50-year-historical epoch a researcher evaluates (Garces and Currie 1000). While the quality of the American workforce has not recorded any ‘‘dramatic’’ improvements over the last fifty years, improved public spending patterns on education have facilitated the maintenance of reasonable numbers of graduates relative to the respective demographic characteristics of a state (Cameiro and Heckman 705).
In an arguably influential article, Andrew Ravenscroft agrees that an increase in public spending in education processes has had some indispensable advantages (459). While the policy has not provided balanced parameters for meaningful evaluations of high school and college students’ achievements, it has made education accessible even to poor American families (Cameiro and Heckman 706). What remains debatable is the policy’s responsiveness to the changing socio-economic needs that emphasize quality-based learning and a highly skilled human capital (Garces and Currie 1000).
On the other hand, the overall effects of poor funding on public education have negatively affected some aspects of economic indicators in various states (Cameiro and Heckman 707). These trends have been prevalent as a result of reduced education outputs and related low labor skills (Hoxby 1209). In many respects, the increase of the number incentives for high school graduates has led to an improved high school attendance. In spite of this, graduation rate has not improved significantly (John 18). In the end, reduced numbers of graduates have led to ‘‘condensed’’ rates of college attendance (Hoxby 1209). Viewed together, an overstretched use of resources meant that disproportionate amount of resources were left to cater for students’ college enrolment programs (Cameiro and Heckman 707).
Public Education Spending Per Student and Economic Growth
According to a recent survey, education expenses per student declined in 2011. Specifically 21 states recorded reduced spending on students’ education. The table below shows recent changes in education spending by state.
Recent Changes (2003-2013) in High School Education Spending
Changes in Dollars
The table below shows the variations on the rates between 2010 and 2011.
Figure 4: Public Education Spending Per Student and Economic Growth
The table above shows drastic changes in education spending on students. Over the last few decades, the dynamics of economic growth patterns as well as technological innovations have become widespread as spending on public education declines (Cameiro and Heckman 801). At any rate, such changes have reduced the number of researches carried out in schools and universities to inform policy-intervention frameworks for improved education and the needs of human capital growth (Mishra 25). However, while the table shows recent reductions in public spending on education, a focus on technological gadgets like laptop computers necessary for today’s learners has been heightened in many states (Ravenscroft 456).
The effects of Disinvestment on Public Education on Enrollment Rates and College Attendance
Research information on the relationship between public spending on education and college attendance reveal elaborate trends in the American fifty states (Hoxby 1210). On the whole, public spending on education varies from one state to the other. However, an assessment of past and recent data on educational trends in many states show increments in the amount of resources allocated and spent in educating Americans (Cameiro and Heckman 708).
For states that have reduced public spending on education in the last ten years, the results on college attendance and the number of high school graduates have been in conflict (Mishra 8). In California, Florida, New York, Minnesota and Texas, financial dedication on higher education has been affected by various economic challenges and rival financial obligations of the states (Cameiro and Heckman 709). In spite of the perceptible rise of higher educational needs, these states’ public education spending has reduced in the past decade (Mishra 19). An assessment of a recent research finding indicates that states with reduced spending on public education, relative to their overall budgets, have realized mixed results (Cameiro and Heckman 709).
In one way, the number of high school graduates that are less likely to get into college is on the increase in such states. Clearly, the measures have frameworks for the reduction of the number of courses, programs as well as learners’ services (Cameiro and Heckman 709). Moreover, in many such states, strategies aimed at limiting enrolment and increased tuition costs have been implemented (Mishra 19). The figure (figure 1) shows the average progressive changes in enrolment rates in the states of California, New York, Florida, Massachusetts, Minnesota, New Jersey and Michigan over the last decade. The common ‘‘denominator’’ in these states is a reduced public spending in college education. The figure is organized by year (horizontally) and percentage (vertically).
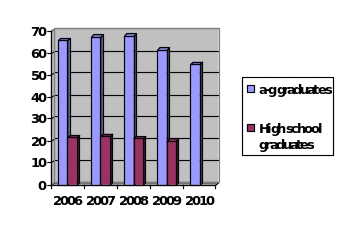
On the other hand, the growing number of online courses in various states such as California and Florida has had a significant bearing on the rate of college enrollments. As a result of increased public spending on online courses and technology, the extent to which the emergence of online courses continues to influence educational processes and enrolment rates is obvious (Appel 18). Because the discovery of the Internet was pegged on the necessity to transmit information, improved standards of university education in different American states remain among its most important outcomes (Arsham 156). In a recent book, Nicholas Carr observes that the process of searching for useful information has become quicker because of improved budgetary allocation on technology-based education (18). In fact, the emergence of online courses has led to the formulation of various distance learning programs in universities across the fifty American states (Appel 18).
High School Graduation Rates and Public Education Funding
Various research reports indicate that a rise in funding on education has increased the number of students graduating from high schools across the American states (Pearlstein 11). While previous researches revealed contradictory outcomes, recent public spending on education has led to higher school graduation rates (Mishra 19). For instance, according to the recent figures released by the United States Department of Education, the average rate of high school graduation in 2008 and 2011 has increased significantly. Although high graduation rates declined in 26 states, an increase was recorded in the other 24 states (Pearlstein 12). Specifically, the states that showed increases in graduation rates had improved funding in high school education programs (Mishra 20).The states with improved funding and higher graduation rates are tabulated in figure 2. However, an evaluation of high school graduation rates (as shown in figure 3) in the last 10 years shows mix results for different states.
High School graduation rates in from 2003 to 2012.
Figure 2: States with Higher Rate of High School Graduation between 2008 and 2011.
While the rate of graduation of the above states was low (at an average of 59 per cent) 30 years ago, the table shows an improvement in the number of high school graduates. The explanation resides in more public spending and improved support for educational programs (Pearlstein 12).
Parents’ Educational Levels, Income Per Capita, College Attendance and High School Graduation
In the face of decreasing income levels for low-skilled individuals in many states and the rise of higher returns for higher education graduates, a significant number of young Americans have become low-skilled school drop-outs than three decades ago (Mishra 25). In other words, enrolment for higher education to meet the ever-increasing socio-economic demands has been poor in respect to the present economic demands and population (Ravenscroft 454). Taken together, many American states have a significant number of unskilled workers compared to most countries of northern Europe today (Mishra 25).
It is widely recognized that the participation of parents in students’ academic activities and their income levels are critical for students’ learning, enrolment rates and graduation in schools across many states. In a research report, Mitch Pearlstein suggests that the degree of a parent’s participation in a child’s education should be the best ‘‘predictor’’ of students’ ability to stay in school more than other evaluative measures (13). Clearly, such evaluation parameters measure the relationship between parental involvements and rates of economic growth (Mishra 19).
Based on the many studies conducted on the role of parents in educational successes across the different states in America, there is a growing acceptance that parents ought to play a critical role in their children’s academic work (Pearlstein 42). Often, there are desirable outcomes whenever educated parents get involved in children’s literacy activities (Mishra 21). This is because a parents’ socio-economic status and their interests in students’ activities determine how children regard studies just as it determines their resolve to remain in school. Research evidence suggests that factors that operate in the course of childhood years have a more significant bearing for college readiness (Pearlstein 42). Besides, such factors are important parameters for assessing majority-minority gaps in socio-economic achievements and economic productivity (Garces and Currie 999).
In many American states, the significance of parents’ educational levels in determining student enrolment rates, college attendance and graduation rates is seen in many ways (Mishra 24). Their role in providing a ‘‘home’’ atmosphere that sustains knowledge acquisition processes is a well-acclaimed contribution (Pearlstein 46). Many studies reveal that the home setting has a substantial impact on what school-going children and teenagers study with ease (Garces and Currie 1000). More significantly, what children discover and develop interests in, in the course of their early, is determined by their parents’ educational levels. This reality confirms the often-talked about belief that a parent is a child’s initial and most critical teacher (Pearlstein 47). Furthermore, factors that determine a teenager’s likelihood to be disobedient in school in the United States are, to a great extent, supposed by their home environments (Garces and Currie 1000).
The manner by which parents convey messages of hope to their children’s successes in education matters (Pearlstein 48). Because children spend a lot of time at home, what their parents say is critical for their ‘‘cognitive’’ development. In most American states, children tend to excel in class work and seek college education when parents affirm their academic abilities (Garces and Currie 1000). In fact, many education-policy makers believe that when educated parents provide moral supportive measures, a student’s comprehension problems are reduced and their love for school is increased (Garces and Currie 1000). In this regard, the collaboration between parents and teachers in many states has improved the probability of a student doing well in school. Such collaborations play significant roles in improving a student’s school attendance and academic performances (Mishra 23).
Furthermore, Erick Hanushek has argued that a parent’s level of education can be an encouragement or an obstacle to a child’s educational success (64). States with higher numbers of parents with advanced educational achievements and knowledge in most academic disciplines are more likely to be report better economic performances (Mishra 23). Whenever such parents participate in a child’s class work, improved performances are expected and higher school graduation rates assured (Hanushek 65). However, states with comparatively ‘‘low-status’’ educated parents record reduced parental interest in children’s literacy activities (Mishra 23). Often, this is because of a feeling of deficiency to assist with school assignments. Analyzed this way, most states with more involved parents in a student’s school activities have had improved enrolment rates and college attendance (Hanushek 65). Partly, this is because they do not depend much on governmental scholarship programs and public spending measures on education to enroll their children in schools (Garces and Currie 1000).
In most American states, parents’ educational qualifications and their per capita income have changed over the years (Garces and Currie 1002). Five decades ago, wage differences between high school drop-outs and graduates was very low. Because of this, parents could easily afford paying fees for their children just as they bought them the necessary learning materials (Hanushek 67). Progressively, there has been a decline in wages assigned to school drop-outs and a rise of income for graduates (Cameiro and Heckman 710). In retrospect, school drop-outs have not been spared the agony being unable to take of care of their children’s educational needs. The explanation here lies in the notion that, even when wages of skilled workers are revised upwards, school ‘‘drop-outs’’ realize insignificant increments. Conversely, most graduate parents earn enough wages to cater for their children’s educational needs (Hanushek 67). For the children whose parents are able to afford the costs of keeping them in school, drop-outs are rarely reported (Cameiro and Heckman 711). On the hand, the ones whose parents can hardly ‘‘respond’’ to school expenses, their children often drop out to seek alternative means of livelihood (Garces and Currie 1003).
The table below (figure 3) shows the average connection in parental education and income per capita to rates of graduation and enrolments across different American States.
Figure 3: Average Gaps in Enrolment, Completion, Delay and Type of College across 50 American States in the last Five Decades (Measured Relative to the Highest Family Background/ APQT quartile)
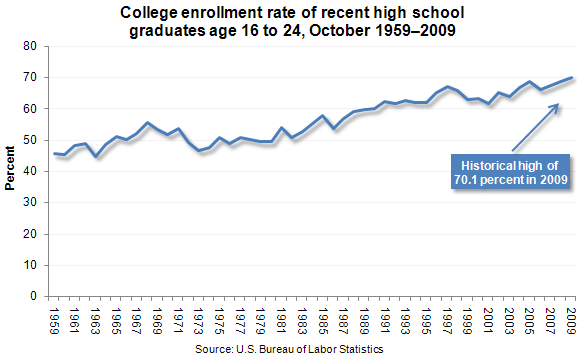
College Enrolment Rates
The Figure demonstrates the average college attendance rate by states since 1959.
Conclusion
Based on the evidence provided in this paper, a number of conclusions can be drawn. One, most states in America have focused more on the traditional methods of ‘‘training’’ human capital by investing more on education. While increased public spending has been a common practice in many states across America, such increments have not led to the often-expected results and economic productivity. Although public spending on education has increased rates of school enrolments and the number of graduates in the course of the last ten decades, the quality of American average workforce has not been as congruent.
Works Cited
Appel, Edward. Internet Searches for Vetting, Investigations, and Open-Source Intelligence. Boca Raton: Taylor and Francis Group, 2011. Print.
Arsham, Hossein. ‘‘Impact of the Internet on Learning and Teaching.’’ USDLA Journal 16.3 (2002): 153-508. Print.
Carr, Nicholas. The Shallows: How the Internet is Changing the Way We Think, Read and Remember. London: Atlantic Books Limited, 2013. Print.
Cameiro, Pedro, and James Heckman. ‘‘The Evidence on Credit Constraints in Post-Secondary Schooling.’’ Economic Journal 112.482: (2002): 705-734. Print.
Garces, Eliana, and Janet Currie. ‘‘Longer-term Effects of Head Start.’’ American Economic Review 92.4 (2002): 999-1012. Print.
Hanushek, Eric. ‘‘The Failure of Input Based Schooling Policies.’’ Economic Journal 113.485: (2003): 64-98. Print.
Hoxby, Caroline. ‘‘Does Competition among Public Schools Benefit Students and Taxpayers?’’ American Economic Review 90. 5 (2000): 1209-1238. Print.
John, Edward. Education and the Public Interest: School Reform, Public Finance, and Access. New York: Springer, 2007. Print.
Mishra, Raymond. Educational Research. New York: APH Publishing, 2009. Print.
Pearlstein, Mitch. From Family Collapse to America’s Decline: The Educational, Economic, and Social Costs of Family Fragmentation. Plymouth: Rowman and Littlefield Publishing Group, 2011. Print.
Ravenscroft, Andrew. ‘‘Promoting Thinking and Conceptual Change with Digital Dialogue Games. Journal of Computer Assisted Learning 23.2 (2007): 453-465. Print.