Purpose and objectives of fault tree analysis and event tree analysis
Fault tree analysis makes use of Boolean logical functions and graphical methods to identify probable faults and likely failures of any given system, to establish the associated hazard, as well as institute corrective measures to the product. This enhances its safety and hence improves its reliability. This analysis adopts the top-down approach in breaking down the problem. The key purpose of fault tree analysis is to identify the shortcomings in a given product or service to come up with the appropriate solutions to the shortcomings. On the other hand, event tree analysis applies the bottom-up criterion in risk assessment for most management and decision systems. Just like fault tree analysis, the method makes use of Boolean combinational logic in developing the analysis (Rechard, 1999).
Idyllically, a fault tree analysis aims at graphically representing the failure interactions that may lead to a top event that has been defined. It is a tool that is powerful, and which is applied in modeling common-mode failures as well as independent combinations. To that effect, it aims at capturing both human errors and the hardware. Thus, the purpose of a fault tree analysis may include the following: QRA (quantitative risk assessment); identifying combinations of occurrences that may lead to hazardous events; PSA (probabilistic safety assessment); Assessing the safety integrity level and complementing HAZOP studies. Also, it is employed in the safety engineering field to quantitatively find out the likelihood of a safety peril.
On the other hand, an event tree analysis aims at quantifying as well as identifying the outcomes of an initiating-event. This is because its logic is usually represented graphically. As a result, it is capable of illustrating the development of an outcome, which might be in manifold outcomes. It is regarded as a tool that is precious, and which is employed specifically in the critique of the effects that are likely to come up from an undesired occurrence, or a malfunction. Indeed, it is used to model accident scenarios that have several safeguards as protective facets (Dietz, 1998).
Event tree analysis stands out in the sense that several failures can be analyzed simultaneously without foreseeing end events, and weakness of the system can easily be identified for rectification. The weakness of this method is that anticipation of operation pathways is necessary whereby some successes and failures cannot be distinguished as is the case for fault tree analysis. Fault tree analysis serves some purposes such as the provision of qualitative and quantitative formats for evaluation as well as giving a vivid system function description leading to undesirable outcomes. Event and fault tree analysis helps in identifying potential failures, particularly in the manufacturing and processing sectors (Hixenbaugh, 1968).
Comparison with other techniques for reliability and risk assessment
Other forms of risk assessment include Failure Modes and Effects Analysis; Bowtie method; and the use of reliability block diagrams. These forms are closely linked to the fault tree analysis except that whereas the methods are inductive, fault tree analysis assumes a top-down deductive approach capable of breaking down the complexity of any given system (Hixenbaugh, 1968). Failure Mode and Effects analysis apply the bottom up approach with a specific focus on a single element (subsystem) of the entire system. This, therefore, indicates that the Failure Modes and Effects Analysis (FMEA) and fault tree analysis (FTA) are complementary methods, whereby FMEA is used to analyze internal initial faults, and FTA is used for multiple external failures affecting the system (Boud, 1993).
Ideally, as Boud (1993) puts it, “FTA can be employed to illustrate how a system is capable of resisting multiple, or single initiating faults, but it is incapable of determining all probable initiating faults”. On the contrary, “FMEA can be employed to exhaustively catalog the initiating faults, as well as to identify their local impacts” (Boud, 1993). However, it cannot be employed in the assessment of multiple failures, or their impacts at a system-level. Nonetheless, the external events are considered by both ETA and FTA, but not in FMEA. The Success Tree Analysis, which is equivalent to a Dependence Diagram, is the commonsensical inverse of the fault tree analysis because it employs a path to depict a system in place of gates. FTA provides the likelihood of a top-event, while both the Success Tree Analysis and the Dependence Diagram evades a top-event and produces the likelihood of success.
Fault tree analysis is simply a failure critique whereby a Boolean logic that is employed is the assessment of the system’s undesired state, to coalesce a series of events that are at a lower level. On the other hand, a binary tree is based on binary logic whereby an event has either taken place or not taken place. In the fault tree analysis, the steps to be followed are system definition; comprehending the system; defining the top event; fault tree construction; qualitative assessment; assigning reliability data; and quantitative assessment. For instance, the function and boundaries ought to be established in the system definition. During, the construction of the fault tree, the following should be done: the gate symbols and types should be set to represent fault tree logic; a top-down approach ought to be employed; and failure modes ought to be identified.
Nonetheless, in the fault tree analysis, minimal cut sets are vital because they can be applied in checking identified failures that may result in top-event. Furthermore, because complex fault trees can be handled by the use of computer codes, minimal cut sets can be manually derived in circumstances whereby the fault tree is simple. Ideally, equipment reliability data is vital in fault tree analysis because it ensures that the available data is apposite and pertinent. To that effect, repair time/test interval can be employed to derive failure probability, specifically from the rate of failure data.
Superlatively, a fault tree ought to encompass dependent failures as well as apposite human errors. This is because the top event is dominated by them. For instance, the dependent failures can be quantified by several methods, such as partial beta factor, reliability factor, and beta factor. Indeed, the established model or historical data can be employed in quantifying human error. Minimal cut sets can be employed in the quantification of a fault tree by use of AND gates, to combine probabilities and frequencies. The result ought to be reviewed, to ensure that the top event is reasonable.
In the event tree analysis, the steps to be followed are: identifying the initiating event; identifying safeguards and then determining the outcomes; constructing an event tree based on all customers; classifying the outcomes in groups with similar consequences; quantifying branch probabilities; quantifying outcomes; and testing outcomes. Thus, an event tree is simply a graphical illustration of scenarios of events that are likely to result from an initiating-event.
Nevertheless, the frequency of end-states or the frequency-of-outcomes can be identified and quantified using an event tree. Furthermore, an event tree can be combined with a fault-tree as part of the Quantitative Risk Assessment and Probabilistic Safety Assessment. Therefore, the mathematics in an event tree critique is relatively simpler in comparison to the one in the fault tree critique. Moreover, in the event tree critique, the frequency of the initiating event should be equal to the sum of end-state frequencies. As a matter of fact and on their own, an event tree can be used with node probabilities that are uncomplicated or can be applied in combination with fault-trees.
Because a forward logic has been employed in the design of the event tree critique, an inductive-approach is provided to scrutinize reliability. Similarly, a deductive approach is used by the dependability of fault trees because they are designed by defining TOP-events and using backward-logic to delineate causes. The critique of a fault tree is closely correlated that with that of an event tree. This is since the logical procedures that are used in the sequences of an event tree, as well as to quantify the impacts are similar to those that are employed in the fault tree analysis (Campbell, 2003).
Fault tree analysis for a reactor coolant system
A cooling system is a very integral component in an industrial setting because it can be used for safety, protection, and even maintenance of equipment (Fayssal 1990). A typical example is a cooling system that is used in power plants, such as the Pressurized water reactor and the Boiling water reactor. Major components of the system include:
- The core: This is the central processing part of the plant
- Pressurizer: Provides and control pressure for the normal working of the system.
- Steam Generator: Propagates steam in the system
- Turbines: They have rotary motion providing mechanical power in the system
- Condensers: Are the main locations for system cooling
- Heaters: They supply heat in the system in prescribed locations
- Valves: Are the main control points for the flow of water and steam
The coolant system is a very important component in any given system especially in a nuclear power plant where a lot of heat is generated. The failure of a coolant system thus has fatal implications to the system and an elaborate risk assessment is essential to containing the situation.
Diagrams
Calculation of failure probability
The test interval has been taken for three months.
The failure rate data is obtained from some sources, such as quantitative risk assessment methods.
Calculations were done based on the formula FP= FRD x time in hours/2
The time interval was taken as 2190 hours (Alber, 1996).
Test interval = (365 x 24) x (3 / 12) = 2190 hours
For example, FP (core) = 22.456E-6*2190/2 = 2.458E-2
Fault Tree Analysis for Reactor Coolant System
The following should be done in the design of a fault tree: the gate symbols and types should be set to represent fault tree logic; a top-down approach ought to be employed; and failure modes ought to be identified. Nonetheless, in the fault tree analysis, minimal cut sets are vital because they can be applied in checking identified failures that may result in top-event. Furthermore, because complex fault trees can be handled by the use of computer codes, minimal cut sets can be manually derived in circumstances whereby the fault tree is simple. Ideally, equipment reliability data is vital in fault tree analysis because it ensures that the available data is apposite and pertinent. To that effect, repair time/test interval can be employed to derive failure probability, specifically from the rate of failure data. A fault tree ought to encompass dependent failures as well as apposite human errors. This is because the top event is dominated by them. For instance, the dependent failures can be quantified by several methods, such as partial beta factor, reliability factor, and beta factor. Indeed, the established model or historical data can be employed in quantifying human error. Minimal cut sets can be employed in the quantification of a fault tree by use of AND gates, to combine probabilities and frequencies. The result ought to be reviewed, to ensure that the top event is reasonable.
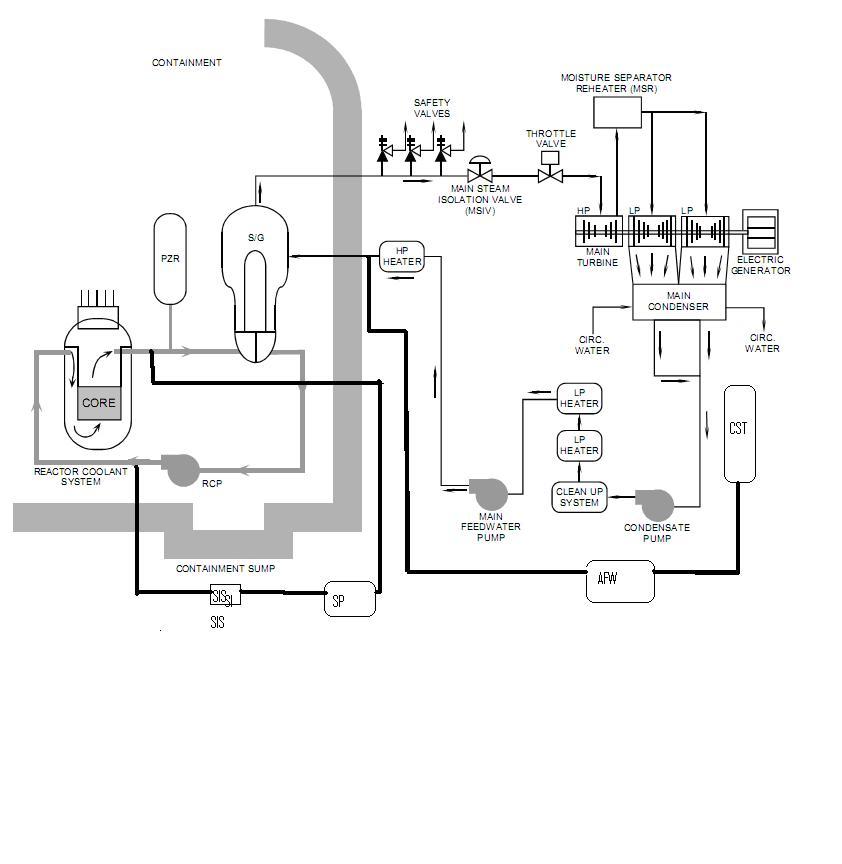
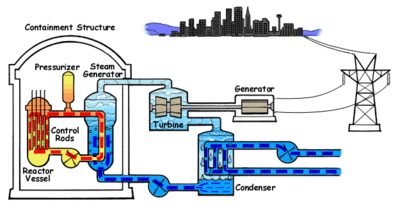
In this case, the top event is the reactor coolant system failure. Overheating is likely to be caused by the failure of the reactant coolant system. This may be caused by the reactor system losing its coolant, which can subsequently be followed by the emergency-core cooling system failing to operate; and the reactor protection system may fail to shut down the reactor cooling system during a major fault. The effect of this failure is that it can result in overheating. Thus, to prevent these impacts, several barriers, such as pumps and safety valves ought to be introduced in the system. In this case (as in figure 1 above), the barriers that have been introduced are the Throttle valve, safety valves, and moisture separator re-heater. In figure 1 above, there is a main steam isolation valve that is used to control the points-of-flow of steam. But, in cases whereby the main steam isolation valve fails, there is a throttle valve that can be employed in emergency cases. Moreover, there is a condensate pump, but in case of failure, the main freed-water pump will be used for emergencies. Figure 2 above has a generator, but in case of failure, the steam generator will be used for emergencies.
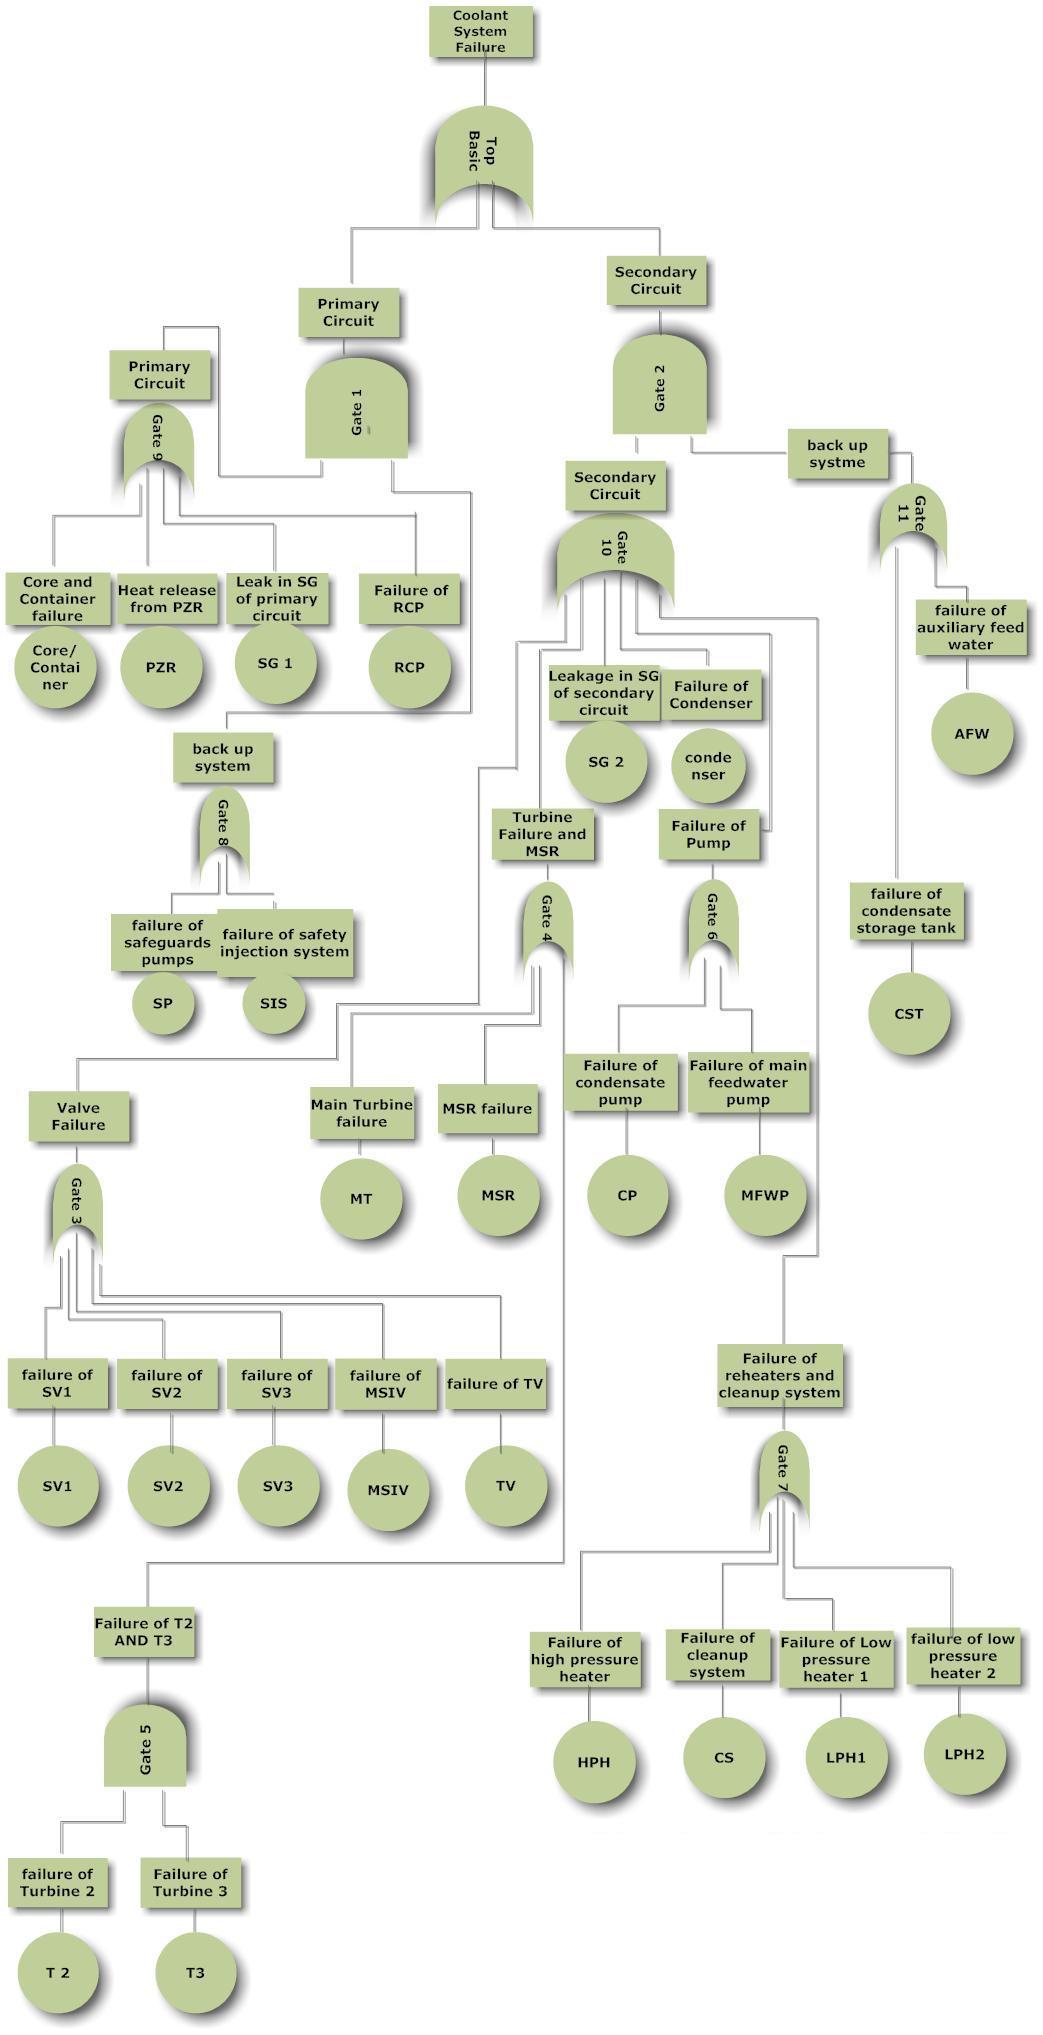
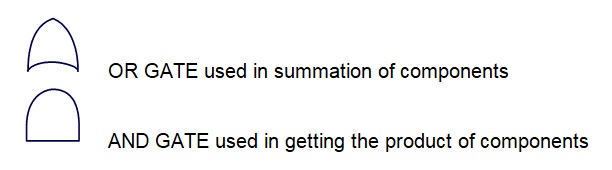
The OR gate is normally used to sum-up components while the AND gate is employed in getting the product-of-components. In the Fault Tree Diagram, the top event is the coolant system failure. However, for this failure to be real, some things ought to take place. For instance, to make the coolant system fail, the primary or secondary circuit should fail. Nonetheless, to make the primary coolant circuit fail (one of the primary system components should fail which are (core and container failure or heat release from PZR or leak in SG or failure of the RCP) and one of the backup system components which are (failure of the safeguard pump or failure of the safety injection system). Idyllically, for the coolant system to fail, it needs a primary circuit or a secondary circuit. In the primary circuit, to back-up the system, the safeguards pump should fail or the safety injection system should fail. And for both T2 and T3 to fail, turbine 2 should fail and turbine 3 should fail
In some cases, there is standby equipment that is capable of providing feed the moment the primary fails. This equipment is usually started by the following systems, which are usually employed in emergency cases: a safety valve, a back-up system for the primary circuit, and the recovery pump. These components will work the moment the system fails. Superlatively, the other source of failure data might be the right gate 11. This is because the other failure could occur to the system, to make coolant system failure, i.e. the auxiliary feed water.
The cut-set table makes use of AND gates in the computation of the probabilities. Cut set values are obtained by multiplying probabilities of two related components in the system. These cut set values are very vital in fault tree analysis since they show trends for different fault points in a given system.
For example, Core*safeguard pumps= 2.458E-2*6.822E-4 = 1.678E-5. Cut set values for the whole system are found in this manner.
Fussel Vessely and Birnbaum
Fussel vessel and Birnbaum values play a critical role in fault tree analysis. These values also indicate the probability of risk in the system.
The Fussel Vesely is obtained by adding all the probabilities containing a specific component in table 2 then dividing by the total probability TP found in table 2 (Ericson, 1999).
For example, (Core.SIS) + (Core. SP)/TP= (1.678+1.538)E-5/4.675E-5=0.678
Birnbaum values are obtained by taking the sum of probability in table 2 and dividing by the specific component probability (Campbell, 2003).
For example, Core/TP= 22.46E-5/4.675E-5=0.483 (Lindsay, 1997).
FTA Conclusion
In conclusion, which is based on the assessment results, the top event is the reactor coolant system failure. However, for this failure to be real, some things ought to take place. The probability values were used while developing this fault tree. Fundamentally, the product of components was got by the AND gate, and the sum of components was got by the OR gate. Furthermore, the most probable cause of the top event was the cut set values. This is since they are deemed to be vital in the critique of a fault tree due to their capability trends of multiple fault points of a given system. Accordingly, the other source of failure data might be the right gate 11. And finally, this system can be improved by accurately computing the Birnbaum values, as well as the Fussel vessel because of their vital role in the critique of a fault tree.
Event Tree Analysis of Plant Hazard
This analysis is based on the event of core failure as discussed below.
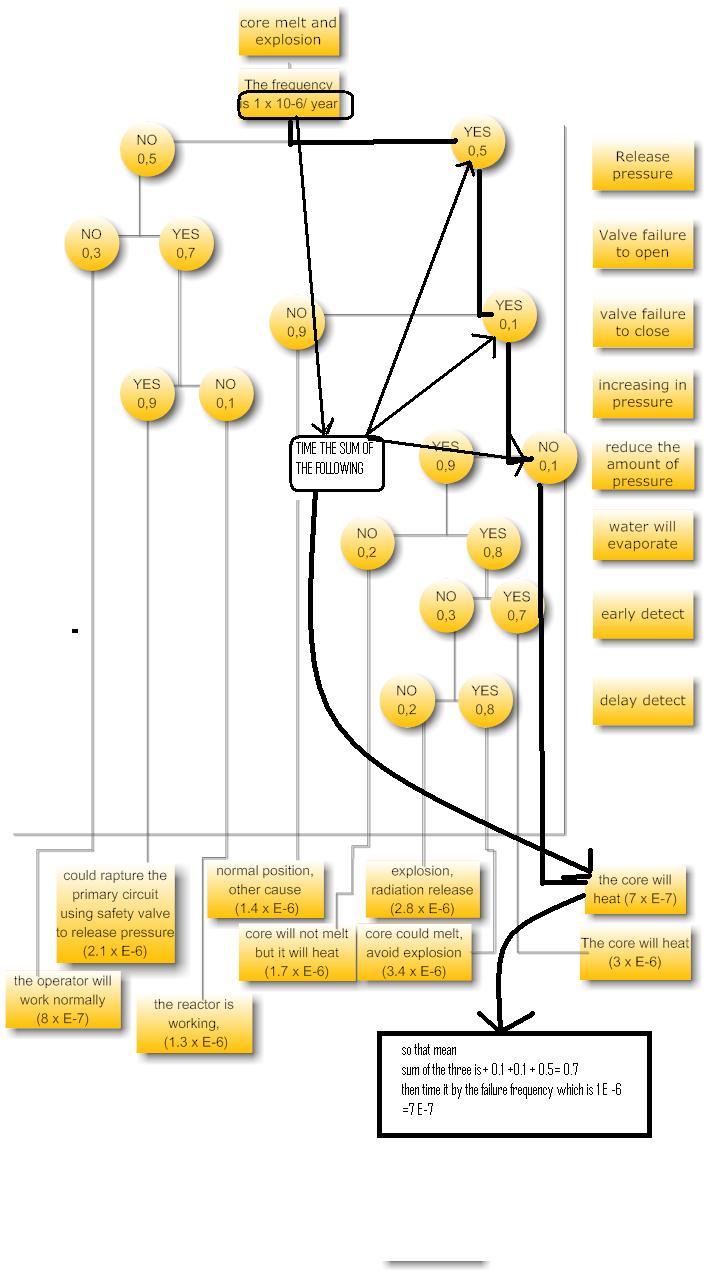
One of the coolant system failures is the core melt and explosion. The core can melt the moment a relentless, compounded failure of a system or components makes the reactor-core to stop being cooled properly, thus making its assemblies to be overheated and/or melt. This may cause them to explode. Nevertheless, the reactor biological impacts of ionizing-radiation can be rendered by a core meltdown. Moreover, a core melt can lead to pressure release, as well as make the reactor to be unusable till it is repaired. As result, the operator will incur additional expenses.
Typically, the event tree analysis is created to illustrate the various impacts of a core melt. For instance, if someone follows a single line from top-event and reaches one of the impacts of the core melt, such as pressure release, then the probability of occurrence is 50 percent. This is mainly due to valve failure, and, thus, it will be open. The probability of a valve failure to take place is 10 percent. Thus, if it occurs, it could result in pressure reduction. The probability of reducing pressure is 10 percent. This will eventually result in the core being overheated and its probability will be 7 E-7. Accordingly, the end states ought to be combined with similar impacts to get the frequency of the core melt as well as the frequency of the explosion.
ETA Conclusion
Basing on the results, the impact with the highest probability is pressure reduction. Its probability is 50 percent. This is because the valve would have failed and thus left open. A core melt can lead to pressure release, as well as make the reactor to be unusable till it is repaired. As result, the operator will incur additional expenses or effort to prevent this from taking place or to repair it.
Discussion
The event tree analysis makes use of both the failure probabilities and determining failure frequencies (Eckberg, 1964). Each component is analyzed in-depth to evaluate the occurrences taking place in case of a failure. The above case sequentially analyses the events that follow the likely core failure due to melting and explosion. For instance, failure rate data for the specific core is given as 1E-6. In case the core fails due to melting and explosion, the system may be affected in various ways. Pressure may be released prematurely, and the valve may either fail to open or close. Furthermore, the amount of pressure may increase or decrease disproportionately, affecting other parts of the system (DeLong, 1970). The control and protection system may fail to detect the failure in a good time, which is again dangerous to the entire system. Event tree analysis here can be used to highlight likely risks associated with core failure to the system (Cammisa, 1995).
While constructing an event tree, we begin with the initiating event that is on the left-hand side and then determine factors across the top. Accordingly, these factors ought to be arranged in a time-based order. Subsequently, the node branches, as well as the logic ought to be determined. And finally, outcomes should be determined and then be classified into similar categories. The initiating event is usually at the top of a fault-tree, and in this case, it is the System Coolant Failure. But, the identified protection is likely to fail, and that is why this event tree starts with a core melt and event explosion (see diagram above). As shown in the diagram above, the end probability for the given situation is obtained by getting the product of individual probabilities leading to the ultimate consequence, which is the product core heating and the failure frequency of the core (Begley, 1968).
CALCULATION: = (0.1 x 0.1 x 0.5) x 1E-6 = 7E-7
Conclusion
Fault and event tree analysis are key methods in risk assessment, especially in identifying the most probable causes of failure and giving details of the multiple failures (Acharya, et al.1990). The methods are thus very important in formulating the possible remedies to the foreseen failures.
Reference List
Acharya, Sarbes, et. al., 1990. (pdf) Severe Accident Risks: An Assessment for Five U.S.Nuclear Power Plants. Wasthington, DC: U.S. Nuclear Regulatory Commission.
Alber, J., 1996. Fault Tree for Safety. Paris: Cooperation and Development.
Begley, T. F., 1968. Cummings. Fault Tree for Safety.
Boud, D., 1993. Fault Tree Analysis Program Pla. Bristol, PA: Open Univeristy Press.
Cammisa, A., 1995. Fault Tree for Safety. Westport, CT: Praeger.
Campbell, A., 2003. Risk Analysis. Princeton, NJ: Princeton University Press.
DeLong, Thomas, 1970. A Fault Tree Manual. Master’s Thesis (Texas A&M University).
Dietz, M.E., 1998. An Overview of Quantitative Risk Assessment Methods. Victoria: Hawker Brownlow Education.
Eckberg, C. R., 1964. Fault Tree Analysis Program Plan. Seattle, WA: The Boeing Company.
Ericson, Clifton, 1999. Fault Tree Analysis – A History. Proceedings of the 17th International Systems Safety Conference.
Fayssal, Safie, 2000. An Overview of Quantitative Risk Assessment Methods/MSFC.
Hixenbaugh, A. F., 1968. Fault Tree for Safety. Seattle, WA: The Boeing Company.
Launer, L.J., 2005. Severe Accident Risks: An Assessment for Five U.S. Nuclear Power Plants.
Lindsay, J., 1997. Fault Tree Analysis Program Plan. Stroke, 28, pp.526-30.
Rechard, Robert P., 1999. Historical Relationship between Performance Assessment for Radioactive Waste Disposal and Other Types of Risk Assessment in the United States.Risk Analysis (Springer Netherlands).