Introduction
The research process involved various data collection methods that included both primary and secondary procedures. The scope of the study was to investigate the technological innovation and customer interface of self-service checkouts using suitable study demographics and study settings. The research process involved aspects such as the assessment of customer perspectives of self-service checkouts. It covered areas such as customer contentment based on perceived waiting time, service quality, price approximation and correctness, and their loyalty intentions towards the self-service technologies.
Data Collection Procedures
Before the study, suitable retailers located in different regions were identified. All the selected retailers were verified to have self-service technologies. Direct interviews were used to collect data from the selected respondents. The survey involved random selection of willing shoppers from the retail stores. The survey was strategically staged to interview the shoppers outside the retail stores after completion of their shopping affairs.
Scope of the Study
Survey Demographics
The study involved a one-on-one interview with different customers at retail shopping stores. Cashiers at the self-check-out points in the retail stores also comprised a part of the selected respondents. Various moderating factors such as age, gender, education level, and cultural norms among others were used. The study categorised the respondents into three groups based on their age. The age bracket categories were 15-25, 26-38, 39-50, 51-60, and 61-80 years.
Table 1: A table showing the survey demographics concerning the traditional, self-scan, and quick-scan checkouts
Study Settings
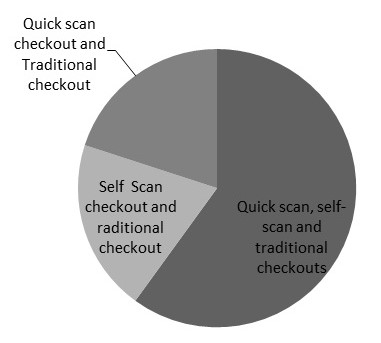
The survey was carried out in five retail stores situated in different locations. One retail store had two types of registers namely the self and traditional checkouts. Another retail store had both traditional and quick scan checkouts while the other three retail stores had the three types of checkouts (traditional, self-scan, and quick scan checkouts).
Traditional checkouts are the cashier-operated registers that do not use self-service technologies (Bitner, Brown, & Meuter 2000). On the other hand, a self-scan is a device placed at the entrance of a retail store. Customers using self-scan checkouts collect this device prior to their shopping. A loyalty card is mandatory for the customer using the self-scan checkout. In addition, the customer can pick a shopping cart at the entrance. However, the use of a shopping card is not mandatory since customers can carry the device in their hands (Atoji 2007). Afterwards, customers walk around the supermarket picking items on the shelves. They scan barcodes of all items collected in the shelves. After picking the required items, the shoppers return the self-scan devices to the authorised places or hand them to the cashier at the doorstep. The ticket showing the total amount of the shopping is displayed on the device’s screen to guide the customer bill for the items (Bitner, Brown, & Meuter 2000).
Quick scan checkouts require customers to scan their collected items after shopping. The devices are located at a designated self-service checkout centre in the retail. The quick scan is ideal for customers with a limited number of shopping items. It does not require the use of loyalty cards. In addition, it does not apply when customers pick shopping carts from the entrance. This type of checkout can also be applicable to particular items such as electronics among others (Bitner, Brown, & Meuter 2000). With the availability of the quick scan, self-scan, and traditional registers customers were to decide the type of checkouts to use while shopping. Most retail shops require customers using such checkouts to enter their stores with self-scan devices. Therefore, customers have to decide at the entrance of the retail shops the type of checkouts to use while shopping. The choice of the checkout depends on the amount of shopping that the shoppers wish to purchase. However, customers with limited shopping items use the quick scan checkouts (Chiu, Fang, & Tseng 2010).
Customer Perspectives on Self-Service Technologies
Customer views on self-service facilities were analysed based on four satisfaction aspects that included perceived waiting time, service quality, price approximations, and loyalty intentions towards the checkpoints.
Satisfaction based on perceived Waiting Time at Checkpoint
Perceived waiting time is the duration between the start of queuing to the point of checkout. Chiu, Fang, and Tseng (2010) posit that the time perceived by the customers in the queuing line at the checkpoint is a significant determinant to their perspectives towards the system. Respondents were required to provide their views based on their perceived waiting time at the checkpoints. They were also required to provide comparisons on the self-scan, quick scan, and traditional scan services.
Perception based on the waiting time depended on several factors. Firstly, the motive of the customers significantly influenced their perceptions of the systems. Customers who were driven by pleasure were not concerned about the duration to shop in the retail stores (Chiu, Fang, & Tseng 2010).Therefore, they were free to use any form of checkout and spent any amount of time they wished choosing items from the shelves (Creswell 2003). They were mainly concerned with the fun of using the self-service technologies. Furthermore, they were not concerned about the queuing duration in the checkouts provided their desires were satisfied. In the study, most of the consumers driven by pleasure and fun used the self-scan checkouts (Curran & Meuter 2005).
Secondly, other customers were driven by time. Such customers preferred quick methods of shopping and shorter waiting lines. For instance, customers in a hurry with limited shopping items preferred using the quick scans (Connolly & Bannister 2008; Parasuraman 2000). Their aim was to accomplish their shopping as fast as possible regardless of the checkouts. However, the study revealed that the self-service checkouts were more preferred by the customers as compared to the cashier-operated points of sale. A number of such customers stated that the personalised points of sale guaranteed service control (Connolly & Bannister 2008).
Other factors that determined checkout selection with reference to the time taken in the shopping store included accessibility, complexity, and technical reliability of the self-service technologies. Time conscious shoppers revealed that the self-service registers were quicker that traditional checkouts. However, new shoppers under this category were technologically conscious and cited technical reliability and ease of use of the self-service tools. In such cases, the customers had no strong opinions for embracing self-service technologies from their inexperience (Dabholkar, Bobbitt, & Lee 2003).
Perceived Service quality
The perceived service quality refers to the customer’s expectations of the personalised point of sale technology in comparison to traditional checkouts. Respondents were required to provide their perceptions of the quality regarding the self-service technologies in comparison to cashier-operated checkouts. The responses were based on aspects such as service control, reliability, and suitability to their shopping. The perceived service quality by the customer depended on numerous factors such as the complexity of the technology. Self-service technologies that were convenient and easy to use attracted many customers while the complex technologies tended to push them away (Davis, Bagozzi, & Warshaw 1989). Customers were not willing to use individual point of sale technologies that were complicated. In addition, they preferred self-service technologies that offered easy interfaces. In such cases, customers were obliged to reliable human machine interactivity. According to Dabholkar, Bobbitt, and Lee (2003), the reliability of the interface design (interactivity) is the consistency, correctness, and accuracy of the self-service technologies. Customers were dissatisfied with poser design interfaces. Other self-service innovations that dissatisfied the shoppers relating to perceived service quality included device failures and technical breakdowns (Dean 2008).
Loyalty Intentions towards Checkouts and Retail Stores
Loyalty intentions towards the checkouts refer to the degree to which a customer is willing to use a particular point of sale technology repeatedly. Respondents were evaluated based on their perceived loyalty to the supermarket checkouts. Further, the study sought to assess the shoppers’ perceptions based on the degree of satisfaction from the quick scan and self-scan point of sale devices (Lee et al. 2010). The survey also examined the shoppers’ willingness to embrace either the quick or the self-scan technologies. Under that parameter, respondents provided their views on their preparedness to tell other customers about the checkout and their intentions to use a particular sale counter in future (Lee & Allaway 2002).
Customer-Buyer Interactions/Personal Interaction with the Retail Personnel
Self-service technologies interrupt personal interactions between customers and buyers. The respondents revealed varying views on how the self-service technologies had influenced their shopping patterns, perceptions of the supermarket, and satisfaction (McKnight, Choudhury, & Kacmar 2002). With the introduction with the innovative point of sale service, the interpersonal interactions (human-to-human interfaces) have been minimised significantly. Human-to-machine interaction replaces customer-buyer relation (Liljander et al. 2006). According to Lin and Hsieh (2005), personal interactions refer to the extent to which customers talk or transact one-on-one with the retail personnel. Many customers visit shopping store with the sole purpose of purchasing their desired goods. However, with the introduction of self-service technologies in the retail shops, customers are left with a variety of options to choose. They are also guaranteed an autonomous control of the point of sale service. Customers can also opt to use cashier-operated checkouts where they can interact with retail personnel (Lin & Hsieh 2005).
Price Estimation
Price estimation is the correctness of price approximations by the customer while collecting items from the shelves. Customers have a list of preferred budgets prior to shopping. The survey revealed that the perception of price correctness and estimations was a significant determinant of their attitudes towards the usage of the self-checkout devices. This situation led to different reactions towards quick scan, self-scan, and traditional checkouts depending on the amount of shopping. Regardless of the fact that customers usually have a list of items prior to shopping, they are occasionally faced with uncertainties of price approximations (Meuter et al. 2000). Most of the respondents affirmed that the devices helped them manage their shopping budgets in the retail stores. However, several factors influenced the price estimation and correctness. With self-scan checkouts, customers scan all the items they collect from the shelves. The technology gives them an opportunity to approximate the total price of their items. Nonetheless, poor self-checkouts have been proven to ruin the shopping experiences of customers. Most of the respondents attested that faulty systems led to unexplained delays that led to time wastage in the retail stores (Makarem, Mudambi, & Podoshen 2009). In such situations, the system only led to consumer dissatisfaction.
Presentation of Findings
Primary Data
Before the study, suitable retailers located in different regions were identified. All the selected retailers were verified to have self-service technologies. Data was collected using face-to-face interviews with the respondents. The survey involved random selection of willing shoppers from the retail stores who were then interviewed outside after shopping.
Secondary Data
The secondary data was gathered from earlier surveys and literature reviews of other researchers. The Internet was used broadly to search information on self-service technologies (quick and self-scan devices) and the parameters for customer satisfaction. Journals and books were also used to gather literature relating to the self-service technologies. Previous studies on self-service technologies in retail settings also provided a rich framework for the research. The search items included self-service technologies, quick and self-scan checkouts, perceived waiting time (queuing), loyalty intentions, and service quality among others.
Summary of the Findings
This section provides an analysis of the findings regarding the information obtained from the research. The presentation of the results is accomplished using graphical methods. The section also provides a critical evaluation of the findings in reference to the research question and description. The presentation of the results is done for customer satisfaction based on perceived waiting time at the checkouts, perceived service quality, loyalty intentions towards the innovative point of sale technology and retailers, personal interaction with the retailers, and correctness of price estimation.
Satisfaction based on the Perceived Waiting Time at Checkpoint
Percentages of respondents satisfied with the perceived waiting time at the checkouts
Table 2: A table showing the percentages of respondents satisfied with the perceived waiting time at the checkouts
The table shows the percentage representation of customer satisfaction based on perceived waiting time in each checkpoint. The data shows that traditional checkouts had the least percentages (25%). The quick scan checkout had 78% representation while the self-scan had the highest representation of 85%
Customer satisfaction based on the perceived waiting time was different based on the type of checkouts in the retail stores. For instance, many respondents showed their satisfaction with retail stores offering the three points of sale technologies. A critical review of the responses proved that the availability of the three checkouts provided customers with an option to choose their preferred checkout while conducting their shopping activities. A number of respondents who used the self-service checkouts attested that the systems were quick compared to the traditional methods. With reference to the self and quick scan checkouts, different respondents affirmed that the devices offered results that were more accurate as compared to the traditional systems. However, this advantage was only limited to the three retail stores offering the three checkout systems. Some respondents stated that the cashier operated checkouts showed the poorest results pertaining to customer satisfaction. The results were based on the perceived waiting time (Meuter et al. 2000).
Perceived Service Quality
Customer satisfaction based on the perceived service quality was represented as shown in the above graph. The traditional checkouts had the least percentage of 45% while the quick scan point of sale technology was embraced by 65% of the respondents. Self-scan checkouts had the highest percentage of 75%. An in-depth analysis of the results revealed that most customers were satisfied with the self-scan checkouts. A number of youths fell in this category citing fun and enjoyment as the driving factors of the adopting the shopping devices. Customer satisfaction based on the perceived service quality was evaluated in all the checkouts. Most respondents stated that the self-scan technologies were better as compared to the traditional checkouts. There was also substantial evidence that service control and less waiting time improved their shopping experiences in the retail stores. Most of the respondents were satisfied with the perceived service quality of the self-service technologies. However, a few of them were dissatisfied with the self-service technologies citing issues of former dissatisfactory due to technical failure of the devices or poor interface design of the technologies (Schilling 2010). The number was bigger amongst the elder people. This situation was attributed to their unwillingness to embrace the innovative point of sale technologies that created a need for human interaction. There were insignificant variations in the number of respondents who were satisfied with the self and quick scan checkouts (Nilsson 2007).
Other respondents stated that limited choice was a primary reason for the dissatisfaction of the perceived service quality. The responses came from the two retail stores that offered only one type of self-service checkout. They stated that the forcible use of certain checkouts or more than one checkout as some of their experiences in the retail stores (Wirtz & Chung 2008). Finally, service quality was influenced by uncertainties relating to purchase decisions using the personalized point of sale technologies. This state of events also applied where the self-service technology failed to meet their expectations probably due to the consequences of making a mistake. However, the perception of the quality of service was significantly influenced by the customer’s satisfaction based on performance, financial, time, social, and/or psychological factors. The study revealed that retail stores offering the three checkouts had the highest number of respondents satisfied with the perceived service quality. (Nilsson 2007).
Table 3: A table showing the consumer’s take on the perceived quality of the traditional, self, and quick scan checkouts
Loyalty Intentions towards Checkouts and Retail Stores
Loyalty intentions towards the checkouts and retail stores were high for the quick scan checkouts with 71%. The quick scan checkouts represented by 69% while the traditional checkouts had 15%. The results depicted that most customers were obliged to using both the quick and self-scan checkouts. However, an insignificant percentage of customers showed loyalty intentions towards cashier-operated checkouts.
Loyalty intentions towards checkouts were also evaluated for both quick scan and self-scan checkouts. From the study, most respondents were oblique to the self-service technologies. They showed loyalty intentions and repeated usage of the point of sale technology. Such respondents had the highest chances of informing other customers about a particular checkout. However, there existed little variations in loyalty intentions for self-scan and quick scan retail shopping systems (Nilsson 2007).
Intentions to use the self-service technologies depended on several factors that included personal interaction with retail personnel, technology anxiety, motivation and willingness to use the SSTs, technology readiness, attitude towards innovation, previous experience, and perceived waiting time (Schilling 2010). The perceived personal interaction with the retail personnel refers to the degree to which the customer is willing to work together with the retail personnel in comparison to the self-service technologies to seek the most satisfying shopping experience. Some customers were compelled to use the self-service checkouts just because they wanted to interact with the retail personnel (Meuter et al. 2000).
Previous experience affects loyalty intentions for SSTs in that customers evaluate satisfaction gained from using the technologies. Customers who were satisfied with the usage of a particular checkout were likely to have more repeated intentions for that checkout (Wirtz & Chung 2008). With respect to the technology and loyalty intentions for a particular checkout, customers were obliged to using checkouts that were easy to use, reliable, and with the least perceived waiting time. Loyalty and repeated usage intentions were also influenced by the desire to control, capacity, needs fulfilment, perceived accessibility, apparent complexity, and technical reliability among other factors (Liljander et al. 2006).
Customer-Buyer Interactions/ Personal Interaction with the Supermarkets
The graph shows that need for personal interaction was highest for the traditional checkout with 65% followed by the self-scan with 15%. The quick scan had the least percentage of 12%.
The study revealed that personal interaction was a factor that was embraced by the least number of customers. The highest number of respondents willing to interact with the retail personnel used traditional checkouts. Most of those willing to interact with the retail personnel while shopping were elderly people over the age of 50 years. In addition, both the quick scan and self-scan checkouts showed no effect on the need for personal interactions with the retail personnel.
Price Estimation and Correctness
Price estimation and correctness had an influence on both the self-scan and quick scan checkouts. Most of the respondents who used the self-scan checkouts were satisfied with the price estimations and correctness. They stated that they approximated prices while making choices of items from the shelves using the scanning devices (Lee & Allaway 2002). Those using the quick scan were not fully satisfied with the price estimations and correctness. The respondents stated that they were not sure of their exact total prices regardless of the fact that they have a list of shopping items. In that case, they only knew the total price of their shopping after confirmation at the checkout centre. Vis-à-vis the traditional checkouts, the respondents showed with the price estimations and correctness (Makarem, Mudambi, & Podoshen 2009).
Summary of the Findings
From the above analysis of customer satisfaction based on the mentioned factors, it can be deduced that many customers are embracing self-service technologies in the retail store settings. The analysis of the survey results also showed that many respondents were satisfied with using either the quick or the self-scan checkouts in retail shops. The major driving factors driving customers to the use the self-service technology were the desire for control, capacity, needs fulfilment, perceived accessibility, observed complexity, and technical reliability of the systems. Retail shops meeting the above requirements for their checkouts had the greatest number of customers satisfied with the self-service technologies. The youths were highly obliged towards the point of sale technology. A greater number of them were satisfied with the self-service technologies adopted in the retail stores.
From the study, it was revealed that customers mostly preferred self-service checkouts that were easily accessible, convenient, and easy to use. This situation led to the development of favourable attitudes towards the technology and a positive effect on the expected service quality. Most retailers use the self-service technology as a way of improving service delivery. Self-service technologies lower personal costs while creating several options that result in customer autonomy over their purchasing decisions. Only one parameter (satisfaction based on consumers’ personal interaction with retail personnel) scored higher in favour of the traditional checkout as compared to the self-service technologies. However, the principal aim of customers was not the interaction with the retail personnel but shopping. This characteristic was only determined by the age of shoppers as the aged people preferred one-on-one interactions with the retail staff.
With reference to the research question, it can be deduced that the customers in the retail setting were obliged towards the self-service technologies. Although there were some variations in the usage of both the quick and self-scans, there was a general agreement amongst the customers on embracing the self-service technologies in retail shops. The choices of the checkout device to use depended on the customer preferences that were subject to other factors discussed above.
Limitation of the Study
Various factors such as distance limited the survey. Gathering information from some retail stores required lengthy travelling. This situation led to time wastage due varying traveling conditions and means. In some settings, data collection took several days. This state of events necessitated visiting such locations severally. Furthermore, uncooperative participants ignored interview calls while others were not willing to answer all the questions. Other respondents were quick in answering questions leaving out some important information. Finally, the study was dependent on the respondents’ interpretative ability of the interview questions. Since the study evaluated the customers’ perceptions towards the self-service technologies, it is obvious that some of their responses were subject to generalisations (Dabholkar & Bagozzi 2002). For instance, questions with positive responses for satisfaction based on the service quality for a certain checkout can be generalised by respondents to mean positive satisfaction for all the aspects investigated on that checkout.
The results showed different perceptions towards the different types of checkouts available in the selected retail stores. They also indicated that the customers had different perceptions of the two types of self-service technology (quick and self-scan). Retailers install self-service devices to improve service delivery. Retailers offering the three checkouts had more advantages compared to those offering the two types of checkouts. The loyalty intentions towards the checkouts and retail shops were high. This situation was attributed to the increased variety of customers who embraced different checkouts.
Future Research
The study investigated the use of self-service technologies in retail settings. It covers the evaluation of customer satisfaction because of using the self-scan and quick scan technology in comparison to the traditional checkouts. In addition, the study involved the analysis of data that was obtained from different settings (three settings with the three checkouts, one setting with both the traditional and self-scan checkouts, and one setting with both the traditional and quick scan checkouts).
The analysis led to the development of some recommendations for future research. At the outset, there is a need to conduct a study that explicitly touches on the analysis of only the quick and self-scan checkouts with a view of providing a deeper elaboration on the customers’ preferences and attitudes towards the systems. Another suggestion for future research is a study on the buying patterns of consumers using online retail stores. This study will elaborate on the consumers’ perceptions towards other technologies where they do not have to visit retail stores.
Conclusions
It is evident that people are obliged to technological advancement that brings change. Consumer propensity to technology is enhanced with increased perceived satisfaction with the point of sales (POS) systems. Technology can be irritating when its fails to meet the expectations of the consumers. In addition, technical failures and regular technological breakdowns can demoralise consumers. The study analysed factors that lead to an overall customer satisfaction using self-service technologies. There is a general consensus that self-service technologies are more effect as compared to traditional checkouts.
References
Atoji, C 2007, Self-service technology helps companies help themselves, Web.
Bitner, M, Brown, S & Meuter, M 2000, ‘Technology Infusion in Service Encounters’, Journal of the Academy of Marketing Science, vol. 28 no. 1, pp.138-149.
Chiu, Y, Fang, S & Tseng, C 2010, ‘Early Versus Potential Adopters: Exploring the Antecedents of Use Intention in the Context of Retail Service Innovations’, International Journal of Retail and Distribution Management, vol. 38 no. 6, pp. 443-459.
Connolly, R & Bannister, F 2008, ‘Factors Influencing Irish Consumers’ Trust in Internet Shopping’, Management Research News, vol. 31 no. 5, pp. 339-358.
Creswell, J 2003, Research Design, Sage Publications, Thousand Oaks, Calif.
Curran, J & Meuter, M 2005, ‘Self-Service Technology Adoption: Comparing Three Technologies’, Journal of Services Marketing, vol. 19 no. 2, pp.103-113.
Dabholkar, P & Bagozzi, R 2002, ‘An attitudinal model of technology-based self-service: moderating effects of consumer traits and situational factors’, Journal of the Academy of Marketing Science, vol. 30 no. 3, pp. 184-201.
Dabholkar, P, Bobbitt, L & Lee, E 2003, ‘Understanding Consumer Motivation and Behaviour Related to Self-Scanning in Retailing’, International Journal of Service Industry Management, vol. 14 no. 1, pp. 59-95.
Davis, F, Bagozzi, R & Warshaw, P 1989, ‘User Acceptance of Computer Technology: A Comparison of Two Theoretical Models’, Management Science, vol. 35 no. 8, pp. 982-1003.
Dean, D 2008, ‘Shopper Age and the Use of Self-Service Technologies’, Managing Service Quality, vol. 18 no. 3, pp. 225-238.
Lee, H, Cho, H, Xu, W & Fairhurst, A 2010, ‘The Influence of Consumer Traits and Demographics on Intention to Use Retail Self-Service Checkouts’, Marketing Intelligence and Planning, vol. 28 no. 1, pp. 46-58.
Lee, J & Allaway, A 2002, ‘Effects of Personal Control on Adoption of Self-Service Technology Innovations’, Journal of Services Marketing, vol. 16 no. 6, pp. 553-573.
Liljander, V, Gillberg, F, Gummerus, J & Riel, A 2006, ‘Technology Readiness and the Evaluation and Adoption of Self-Service Technologies’, Journal of Retailing and Consumer Services, vol. 13 no. 4, pp. 177-191.
Lin, J & Hsieh, P 2005, ‘The Influence of Technology Readiness on Satisfaction and Behavioural Intentions Toward Self-Service Technologies’, Computers in Human Behaviour, vol. 23 no. 6, pp. 1597-1615.
Makarem, S, Mudambi, S & Podoshen, J 2009, ‘Satisfaction in Technology-Enabled Service Encounters’, Journal of Services Marketing, vol. 23 no. 3, pp. 134-144.
Schilling, M 2010, Strategic Management of Technological Innovation, McGraw-Hill, New York, NY.
Meuter, M, Ostrom, A, Roundtree, R & Bitner, M 2000, ‘Self-Service Technologies: Understanding Customer Satisfaction with Technology-Based Service Encounters’, Journal of Marketing, vol. 64 no. 2, pp. 50-64.
Nilsson, D 2007, ‘A Cross-Cultural Comparison of Self-Service Technology Use’, European Journal of Marketing, vol. 41 no. 3, pp. 367-381.
Parasuraman, A 2000, ‘Technology Readiness Index (TRI) a multiple-item scale to measure readiness to embrace new technologies’, Journal of service research, vol. 2 no. 4, pp. 307-320.
Wirtz, J & Chung, M 2008, ‘An empirical study on the quality and context-specific applicability of commonly used customer satisfaction measures’, Journal of Service Research, vol. 5 no. 4, pp. 345-355.