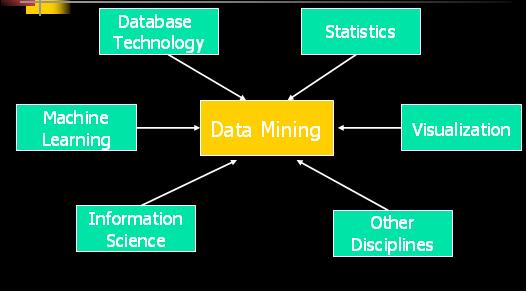
Today in information technology era, there is ample of information available and a number of users are accessing data daily for their use and requirements. Data mining is a commonly used term in computer field. Data mining is the process of sorting huge amount of data and finding out the relevant data. Usually ERP systems are used for sorting data in large organizations. Data mining posses a strong relationship with entity resource planning and the relation of both is a statically and logical analysis of huge transaction data looking for the ways to help in decision making. “Data mining is commonly known as knowledge discovery. This is the process of analyzing data from numerous perspectives and summarizing it into useful information for further processing.” (Chen, 2001) There are numerous data mining software are also available which act as a data mining tool for analyzing huge amount of data. “Data mining is a process which allows user to analyze data from different angles and dimensions. In large relational databases data mining helps in correlating patterns among dozens of fields.” (Data mining, 2000) Data mining is a new term but in short time it has gained so much popularity. Companies use powerful computers to sift large volume of data over large network. Data mining is primarily used by large organization in order to improve their routinely task and saves time. “Data mining in large organizations is used with a strong consumer focus, communication and marketing organizations.” (Chen, 2001) Data mining over large network helps companies to manage their internal factors and also helps in creating strong bond between internal factors such as price, product, positioning etc. Oracle and PHP has an ability to deal with large volume of data using data mining techniques. Different methodologies are specially designed keeping an eye on frequent changing needs of today’s world and market. Data mining is widely used as a powerful tool in the construction of computer graphics applications. They are specially designed for graphical mapping, data mining is also used for development of computer graphics as the solution for TSP. Visualization data mining techniques are helpful in real market as they provide a clear path for further processing based on real facts. “Information visualization and visual data mining help in dealing with large amount of data” (Data mining, 2000). Data mining on incomplete data result varies depending upon the implementation and time complexities. Data visualization instruments are very helpful in presenting data in human understandable graphics images or animation. Human computer interface allows human to interact with computerized images and also allow human to perform various operations on computer graphics.
Data Mining Purpose
Data mining is primarily used in large organizations and provides opportunity to create strong relationship among internal factors of their organizations. “Internal factors of an organization involve price, sales, product positioning, staff skills and external factors of an organization involve competition, customer demographics and economic indicators. Data mining over large network enables management to determine the impact on sales, customer satisfaction and product quality.” (Chen, 2001) It also empowers management to drill down all facts into a summary for further use. By data mining a retailer can easily point out its annual sales and also target forecast product availability based on individual purchase history. With the help of data mining technique a retailer can judge his sales and annual promotions.
How Data mining works
Data mining is primarily designed to sort information or relevant data from large volume of transactional data. On a large scale network data mining provides relationship between the two and separate transaction and analytical system. “In the market, different types of software are available for neural networks, statically and machine learning.” (Data mining, 2000) Usually four type of relations work in data mining process. “Data mining process consist of five elements which are as follows:
- Data mining sorts, extracts and load transaction data on to the data warehouse system.
- It stores and manages data in multidimensional system
- It provides easy database access to professionals and analyst.
- It uses application software for analyzing data.
- It always presents data in table format for easy and clear understanding.” (Data mining, 2000)
Different level of analysis is involved in data mining process. Few of them are as follows: Artificial neural network, genetic algorithm, decision trees, nearest neighbor hood method, rule induction, data visualization. Nowadays, data mining process is available and implemented on all size of machine. System prices vary depending upon the size and performance of the system. NCR is one of the biggest systems which have ability to deliver application exceeding 100 tetra bytes. “In this process, two critical technological drivers are involved: size of the database and query complexity.” (Data mining, 2000) Size of the database is related to the terminology that more data processed and maintained, the more powerful system is required. “The system capacity highly depends on query complexity, the more query is complex the more powerful system is required” (Data mining, 2000). Data mining functionality involves characterization, classification, discrimination, trend analysis, clustering etc.
Why data mining
Data mining is the process which helps in different fields, today data mining process is widely used in computer graphics field. Data mining helps in numerous business application it highly supports in decision making, it also helps in risk analysis and management, fraud detection and its management, text mining and intelligent query answering. It also helps in customer retention, improved underwriting, quality control, cross selling and market segmentation.
“Data mining can be applied in different fields, few of them are as follows: Relational databases, Data warehouses, Transactional databases, Advanced DB and information repositories, Object-oriented and object-relational databases, Spatial databases, Time-series data and temporal data, Text databases and multimedia databases, Heterogeneous and legacy databases, WWW.” (Bederson)
/var/www/blog-sandbox.itp/wp-content/uploads/2021/09/192257_1.jpg 528×293 24bit N JFIF [OK] 21639 –> 18696 bytes (13.60%), optimized.
Data mining issues
There are certain issues involved with data mining; the most critical issue involved with data mining process is violation of privacy. Data mining process enables user to analyze routine business transaction and allow to access information about individual buying and purchase habits. “Another issue involves with data mining is data integrity.” (Bederson ) For example a bank maintains credit card details on multiple databases, the pin, address or cardholder name may be different in each and software translate data from one system to another and select the address most recently entered, this creates data integrity issue over large networks. One other technical issue involved in data mining is whether it is suitable for relational databases or multidimensional one and as with the increasing use of internet the whole world has become client server architecture. “Cost issue is also associated with data mining. Hardware system cost has dropped dramatically in past few years and data mining tend to be self reinforcing.” (issues, 2000) Usage of large data with pressure for large and powerful system usually cost more than others (issues, 2000).
Methodology
Information visualization and visual data mining
With the passage of time analyzing large volumes of data has become a great challenge in graphics field. “Information visualization and visual data mining help in dealing with the flood of information in computer graphics. The advantage of visual data mining is that the user gets directly involved in data mining process.” (Diehl, 2002).
There are large number of data mining techniques widely used in dealing with angles, graphs, pixels and axis and gives best output.
Software visualization
“Software encompasses the development and evaluation of the methods for graphical representation from different perspectives such as structure, execution and evolution. Software visualization is not associated with the construction but it highly associated with analysis program and development process. Software visualization combine techniques such as software engineering, programming languages, data mining, computer graphics, information visualization and human computer interaction” (Diehl, 2002).
Classification of visual data mining techniques
Visualization focuses on numerous types of data sets lacking inherent 2D or 3D semantics and it also lacks of mapping data on physical screen space. There are number of techniques for visualizing data sets such as x-y plots, line plots and histograms. All these techniques are useful but are limited to only small and low dimensional data set. In last couple of years, a huge number of visual data mining techniques have been developed allowing visualization of multidimensional data set without inherent 2D or 3D semantics. The techniques can be classified by three aspects: data to be visualized, visualization technique and distortion technique used. Type of data may be one dimensional data, two dimensional data, multidimensional data, text and hypertext, hierarchies and graphs, algorithm and software. The visualization technique can be classified on the basis of 2D & 3D displays which include pie charts, bar graph as used in Polaris, landscape and parallel coordinates are used in scalable framework, icon based displays, dense pixel displays and stack displays.
Visualization data mining techniques can assume to be orthogonal (Daniel, 2002). Orthogonally means that a technique can be used in conjunction with any of the interaction techniques for any data type. The goal of visualization is to support software development by helping algorithms easy to understand, analyze and implement. There are a large number of data mining techniques which can be use for visualization of data. The classes usually corresponds to basic visualization techniques rules which may be combined in order to implement a visualization system. For an effective data exploration it is necessary to use some distortion technique. Interaction and distortion technique allows data analyst to interact directly with the visualization and dynamically change visualization according to exploration objectives. They also make possible to combine various visualization on a single platform (Wang, 2002).
Distortion techniques are specially designed for the help in data exploration process by focusing on details while preserving an overview of the data. The primary goals of distortion techniques are to show high level of detail with the lower level of detail. For the exploration of multidimensional data set dynamic projection are used to change the projections. For exploring large data sets it is necessary to partition a data set into multiple segments and focus on interesting subset. This can be done by selecting or focusing on desired subset. Browsing is very difficult for large volume for data, interactive filtering solves this problem up to high extent. The exploration of large data sets is important but difficult problem, information visualization techniques helps a lot in resolving this issue effectively. Visual data exploration has a high potential for visualization of large amount of data in computer graphics. There are number of techniques available which can be classified on the basis of data and interactive and distortion techniques (Bederson, 1994).
Clustering
Clustering is a process of portioning set of data in meaningful classes for further processing. Clustering is widely known as unspecified classification which has no predefined classes. Clustering is a division of large data into small similar groups. Clustering is a common term used in data mining. Data modeling places clustering historical perspective rooted in math, statistics and numerical analysis. There are number of perspective to view clustering techniques in data mining in computer field. “Clustering plays an important role in data mining applications. Clustering has become a classical problem in databases, graphics, data warehouses, pattern recognition, artificial intelligence, neural networks and computer graphics.” (Daniel, 2002) Application in point based graphics has given rise to new methods and algorithms for the clustering algorithms. Adaclus is one of the best algorithms for clustering of computer graphics. “Adaclus perform clustering purely automatically without setting any parameters at initial state; it gives the user an option to set three parameters with clear mining for the adjustment of clustering in special applications.” (Daniel, 2002) Adaclus algorithm has tested on two-dimensional data set. Data mining works on large databases, clustering resolves scalability problems in large databases. Following are some properties of clustering algorithms: type of attributes an algorithm can handle, ability to find clusters of irregular shape, time complexity, ability to work with high dimensional graphic data, interpretability of results. Hierarchical clustering is also very famous in computer graphics as it develops cluster hierarchy and tree of clusters widely known as dendogram. Use of clustering in computer graphics is very common and widely used for numerous applications.
Statistical inference (Probability modeling & prediction)
Data mining primary aim is to discover relevant facts and new observation recorded in a database. Due to some reasons such as encoding errors, measurement errors and recorded features the information is usually noisy. Due tot his reason inference from large databases invites numerous concepts specially probability theory. According to statically point of view, databases usually contain uncontrolled convenience samples due to which data mining process becomes little difficult in number of cases. “Inference involves following features such as estimation, consistency, uncertainty, assumptions, robustness, model averaging.” (Han, 2004) Statistical theory in data mining provides measures of uncertainty and many methods of calculating them for many families of the estimators. Probability is the concept or measure of counting that how many times an event will occur out of a number of possible events. Probability is widely used term in data mining of computer graphics. Probability models highly depend on random variables which are widely used to determine occurrence of an event in limited time. Application for the data mining specifically designed for graphical mapping of point based graphics has of great significance (Han, 2004). Data mining is also used as a tool of in the construction of computer graphics as the solution of TSP and also used in the implementation of neural networks. In past few decades, the growth of information technology and use of graphics has increased a lot and it converted the use of single databases into distributed systems. There are number of models and prediction models based on different facts and figures. In data mining a user request prediction method based on data mining approaches highly relies on angles and degrees of an image. By analyzing large amount of data accumulated over long time.
“Prediction method usually takes advantage of the integration of data mining technology in parallel computing. It maximizes server ability of parallelization from the acquired knowledge of experimental results” (Toe, 2006). Prediction in data mining field is a powerful tool by which one can determine the flaws of complete flow. Predictive analysis helps in determine and may benefit current marketing operations. Classification and prediction in data mining helps a lot in working on different point based, 2d or 3D graphics. “Data mining is a process of discovering the patterns and trends in large databases.” (Toe, 2006) Prediction and probability models help in determining the exact pixel location and angles and are useful while implementing the large graphical applications.
Conclusion
Data mining is a process of sorting relevant data from large amount of data and categorizing data into multiple sets. In a computer field, there are numerous types of data; few of them are text data, hypertext data, one dimensional data, two dimensional and three dimensional data. Nowadays data mining in computer graphics is widely used in the development of special applications. Data mining involves different steps and different process. Data mining can be classified with number of perspectives and are useful for developing numerous applications (Keim, 1996). Clustering, classification is two of the most important concepts in data mining. There are different algorithms are present which perform a number of operation for sorting data over large networks. There are numerous methods and algorithms for data mining in different application according to the needs of organization and management. Data mining helps in decision making as it provides exact figures and facts derived from ground realities. Different issues are also involved in data mining process including cost. High level performance and demand of fast execution usually increases the cost. Dealing with huge amount of data over distributed system is a challenge for developers.
Computer graphics is a vast field and numerous algorithms are available for the construction of computer graphics software. Nowadays developers and management team is taking lots of advantages from data mining techniques over large distributed systems. Although there is a wide room for improvement in data mining algorithms as time complexity and performance are two main hurdles in the construction of successful applications. “Some issues need consideration in data mining techniques, two important issues is time complexity and cost.” (Toe, 2006) Time complexity and high cost declares an algorithm failure. An interactive visual data mining system consists of various components which assures its success in various fields. The optimum objective of interactive data mining is to allow data miner to perform different techniques on images to obtain required results. Algorithms and methodologies help a lot in obtaining required results in computer graphics. Data and modeling assembly allows user to interact with the computer in its understandable language and gives visual instruments for data mining.
References
- Data mining, 2000, Data mining.
- Data mining Issues, 2000, Data mining: issues.
- S. Diehl, 2002, Software Visualization, volume 2269 of LNCS, State-of-the-Art Survey. Spnger Verlag.
- Bederson, “Pad++: Advances in multistage interfaces,” inProc. Human Factors in Computing Systems CHI ’94 Conf.,Boston, MA, 1994, p. 315.
- Daniel A.Keim, 2002, Data mining and visualization techniques.
- Tao Ye, 2006, E-Learning in Industrial Electronics, 2006 1ST IEEE, International Conference on Volume, Issue, Page(s):40 – 45, Digital Object Identifier 10.1109/ICELIE.2006.347209.
- Jiawei Han, 2004, Data Mining, Concepts and Techniques, Data Mining: Concepts and Techniques.
- Chen, 2001. An integrated interactive environment for knowledge discovery from heterogeneous data resources. Information and Software Technology, 43(8), 487-496.
- Keim, 1996. Visualization techniques for mining large databases: a comparison, IEEE Transactions on Knowledge & Data Engineering, 8(6), 923-938.
- Wang, S. 2002, nonlinear pattern hypothesis generation for data mining. Data & Knowledge Engineering, 40(3), 273-283.