Introduction
Globally, sand storms cause serious environmental, health, and economic problems (Rivas-Perea & Rosiles, 2012). However, when they occur, their effects are more serious in urban areas because of the high concentration of people and economic establishments in these areas. Environmentalists register serious concerns regarding sand storms because of their high concentration of harmful particles (like aerosols) (Rivas-Perea & Rosiles, 2012). Nonetheless, the health, economic, and environmental effects of sand storms stand out as a major concern for not only environmentalists, but also health agencies, and geological science agencies as well (Blackwell, 2011).
Timely warnings of sand storms are crucial features for community safety, especially in regions that are vulnerable to such environmental hazards (Nuwayhid & Youssef, 2012). There are several methods for detecting sand storms, but several questions exist regarding the efficacy of some of these methods (Rivas-Perea & Rosiles, 2012). Furthermore, some researchers still consider sand storm detection as an open problem for statistical analysis and modelling (Wasimi, 2010). These concerns are very important in the modelling of rapid response systems, because Rivas-Perea & Rosiles, (2012) say sound rapid response systems take minimum processing time and produce results of high or moderate imagery.
The remote sensing community has proposed several approaches for detecting and classifying multispectral data in the sand storm detection process. For example, Hillger (2003) and Agarwal (2007) have proposed several methods for improving the visualization of sand storms, although their methodologies have been marred with the detection of other images, apart from the dust storms (thereby compromising the quality of their images). In this regard, many observers agree that there is a need to develop a more accurate imagery for sand storm detection (Ecotech Pty, 2013). Other observers say there is a greater need to evaluate the existing imaging methods to determine which ones have the best odds of succeeding in specific geographic locations (Rivas-Perea & Rosiles, 2012).
This literature review focuses on the detection and analysis of sandstorms in the United Arab Emirates (UAE). The paper however draws comparisons with other regions that have the same climatic conditions as the UAE. In detail, this report investigates the characteristics of atmospheric dust in the UAE and the effect of vegetation and land cover in influencing dust emissions in the region. Furthermore, this paper also explores a range of remote sensing models for dust detection (through the analysis of new models for dust detection such as the SEVIRI, MODIS, and AERONET methods). More details regarding these models show the quantitative indicators of dust and their differentials across different wavelengths. Finally, this paper produces wind resource maps for the UAE, through the adoption of the GIS, WindPRO and WAsP programs. Comprehensively, these analyses show the efficacy of remote sensing methods and meteorological variables in the UAE.
Sources of Atmospheric Dust
In the last two decades, many researchers have tried to investigate the major mineralogy and chemical element compositions of atmospheric dust in different geographic regions (Hamza, 2011). Hamza (2011) says scientists have made most of these analyses with a careful consideration of the effect of these compositions on terrestrial and marine ecosystems. Many of the researchers who have participated in these research studies have acknowledged the contribution of desert dust in increasing traces of continental origins in marine ecosystems (Hamza, 2011). Of particular interest has been the high concentration of nitrogen, phosphorus, and iron. Scientists consider these elements to be crucial components in the sustainability of marine life (Hamza, 2011).
The above studies however concentrate on marine life as opposed to human life. Moreover, the studies focus on the North Atlantic and Mediterranean regions as the main sources of sand storms, as opposed to the Arab peninsula as another major source of sand storms. In this regard, there are scanty details regarding the composition of atmospheric dust in the Arab peninsular, their contribution to the earth system, and more specifically, their effect on the earth system (through the Arabian Gulf).
Hamza (2011) says, “the Arabian Peninsula is one of the largest desert areas in the world, being characterized by arid conditions, monsoon winds and consequently large areas of sand dunes” (p. 266). Strong monsoon winds that occur during spring and summer mainly cause the dust storms. Hamza (2011) says that the atmospheric dust composition of the sand particles normally vary with the season and direction of the winds. Meteorologists know the Arabian Gulf for its warm temperatures of between (35-45) degrees, but rainy conditions still prevail, especially when the sandy particles in the dust storms act as mediums to condense water vapor (Ecotech Pty, 2013). Hamza (2011) says that the rainstorms account for the wet deposition of dust particles that suspend over the Arabian Gulf during rainy seasons.
The UAE covers a huge portion of the Arabian Gulf. Its sand storm patterns do not differ much from the above description. In fact, Hamza (2011) says that dust storms affect most part of the UAE atmosphere for most months in a year. The UAE National Centre of Meteorology and Seismology (NCMS) has been the main source of data for understanding the wind and sand storm patterns in the UAE. Most of the data sourced from this department come from meteorological stations that are located along the UAE coastline.
Health Complications Associated with Sand Storms in the UAE
Kwong & Underwood (2009) report worrying concerns about the increasing health problems associated with dust storms in the UAE. In 2009, a leading medical expert in Abu Dhabi warned patients with respiratory diseases from going out of their houses during dusty days because this could aggravate their health conditions. Another medical expert named Bassam Mahboub (cited in Kwong & Underwood, 2009) said about 15% of UAE’s population suffered from dust-related asthma.
For instance, the increased number of patients in Al Mafraq Hospital (Abu Dhabi) who suffer from respiratory disease is enough evidence of the increasing number of admissions caused by dust storms (Kwong & Underwood, 2009). In fact, in a past interview, a leading medical practitioner in Abu Dhabi (who worked at Al Mafraq Hospital) said that because of dust storms, there have been an increased number of patients suffering from respiratory diseases, (especially asthma) in the UAE (Kwong & Underwood, 2009).
If the worsening medical conditions may be quantified monetarily, the Middle East-Asia Allergy Asthma Immunology Congress says, “Allergies may cost the Middle East and North Africa region more than $2.5 billion (Dh9.1bn) annually in medical costs, time off work and lost productivity” (Kwong & Underwood, 2009, p. 5). After the common cold, a leading medical researcher in the UAE claimed that dust-related complications were the leading causes of asthma attacks in children. Some medical circles in the UAE now say patients who suffer from respiratory diseases should wear masks to prevent the harmful effects of dust (Kwong & Underwood, 2009).
However, not only medical experts who focus on respiratory problems register increased numbers of admissions from sand storms; eye care specialists have also registered the same increased numbers of admissions in the UAE. Most of the cases associated with eye-care complications stem from the increased incidences of conjunctivitis among patients. Some patients said they felt foreign bodies in their eyes (Kwong & Underwood, 2009). Eye care specialists in Dubai also say that they have seen more patients with dry and irritated eyes because of the increased exposure of patients to sand storms.
Remote Sensing Models of Dust Detection and Monitoring
Sand Storm Detection
El-Askary & El-Ghazawi (2012) say that past capabilities in dust storm detection relied immensely on GOES, Landsat, Sea WiFS, TOMS, and AVHR techniques. However, El-Askary & El-Ghazawi (2012) says that the Aqua technique provides more capabilities for dust storm detection. Similarly, they say that geosynchronous detection satellites also provide an effective tool for detecting and tracking dust storms (El-Askary & El-Ghazawi, 2012). Their high temporal solution (of about 15 minutes) provides the best justification for their acceptance in dust storm detection. Since scientists detect suspended dust through changes in image brightness, the failure of some detection techniques to use a broader spatial and spectral resolution limits their accuracy in detecting most storms. In fact, El-Askary & El-Ghazawi (2012) say that most of such techniques have a spatial scope of one km and one visible spectral resolution that prevents them from detecting small storms. Cloud cover also inhibits their visibility because poor temporal resolutions in some techniques (like GOES) experience immense difficulty taking accurate images when there is a thick cloud cover. El-Askary & El-Ghazawi (2012) propose that some dust detection techniques like Sea WiFS have a high spectral resolution that cuts them above the rest. Indeed, they say, “The spectral resolution of Sea WiFS images is among the best methods available for detecting large dust plumes that last for a long time and have a dark (low-radiance) background (the ocean)” (El-Askary & El-Ghazawi, 2012, p. 4). Because of their attributes, scientists have used Sea WiFS to detect dust storms in several parts of the world, including Africa and Asia. Nonetheless, Sea WiFS pose a problem when detecting small dust storm in desert areas like the UAE.
Consequently, some experts have shifted their focus to newer and better methods of dust storm detection such as MODIS and AVHRR sensors (El-Askary & El-Ghazawi, 2012, p. 4). Many experts prefer these techniques because of their higher temporal resolutions (Melin, 2010). For example, MODIS has a high temporal resolution that allows it to detect dust emissions and identify the vulnerability of a region to wind erosion (Melin, 2010). Gad-el-Hak (2008) singles out the MODIS technique for its ability to detect dust storms in the Middle East because of its high spectral and spatial resolutions. El-Askary & El-Ghazawi (2012) also approve its use by saying, “Utilizing Terra and Aqua MODIS provides an improved temporal resolution over AVHRR as their combined coverage is now twice per day” (p. 3). El-Askary & El-Ghazawi (2012) say that quantifying information in the vertical is a necessary step in the process of dust storm detection because “Terra/Aqua quantitative data are necessary for the identification of spatiotemporal distributions of dust plumes as well as for vertical profiling at pre-selected locations to inter-compare the models with RS in the vertical distribution” (p. 2).
Lastly, the SEVIRI technique also surfaces as an important dust storm detection technique. The scope of the SEVIRI instrument covers a spectral range of between 0.4 to 1.6 mm (four visible/NIR channels) and a wavelength of 3.9-13.4 um (eight IR channels) (Schmid, 2012). The resolution comes from about 36,000 kilometers (altitude) (Schmid, 2012). This entails one km for the high-resolution visible channel and three km for the infrared. Three other visible channels also exist in this subset. The focal plane for the SEVIRI instrument coils to 85/95k and it takes one image every 15 minutes (Schmid, 2012). This amounts to about 245,000 images over a 7-year nominal lifetime. Lastly, its data rate is about 3.26 Mbit per second (Schmid, 2012).
The imaging radiometer for the SEVIRI method often corresponds to how the permanent imaging of the earth occurs. This happens using about “12 spectral channels with a baseline repeat cycle of about 15 minutes” (Schmid, 2012, p. 4). Schmid (2012) further says, “the imaging spatial resolution is three km at sub-satellite point for standard channels and down to one km for the High Resolution Visible (HRV) channel” (p. 4). Scientists have used the SEVIRI technique to detect dust storms in desert areas likes the Middle East.
Monitoring Sand Storms
Ultraviolet Range
Scientists may monitor dust storms using the ultraviolet range, as was proposed by El-Askary & El-Ghazawi (2012) when they did a study to examine dust storms in the Nile Delta. They used the total zone mapping spectrometer (TOMS) for this purpose. The TOMS method worked by detecting aerosol particles through the evaluation of backscattered ultraviolet radiation (Nicholson, 2011) as shown below:
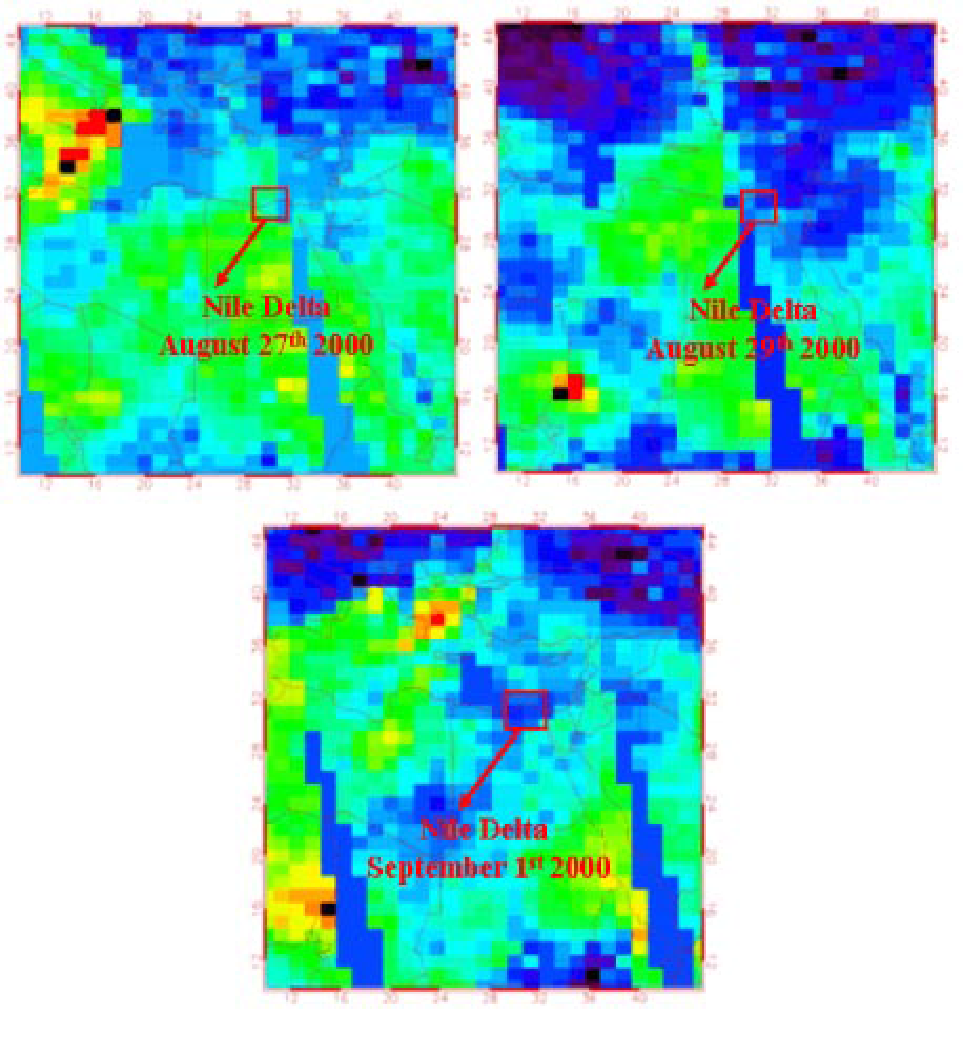
The images showed that the ultraviolet range had a poor spatial resolution. Therefore, it was difficult to detect small sandstorms. For example, in the above illustration, the ultraviolet range proved to be impractical in detecting small sand storms in the Nile Delta. Moreover, El-Askary & El-Ghazawi (2012) says, “the TOMS sensor responds to backscattered radiation caused by Rayleigh scattering which is most prominent at relatively long wavelengths compared to particle size” (p. 1).
Physical Range
Besides monitoring dust storms in the ultraviolet range, scientists may monitor dust storms in the physical range. The MISR technique stands out as the first satellite sensor that may view different angles of a sand storm (National Research Council, 2000). Through the Nile Delta study, the MISR technique showed the following image.
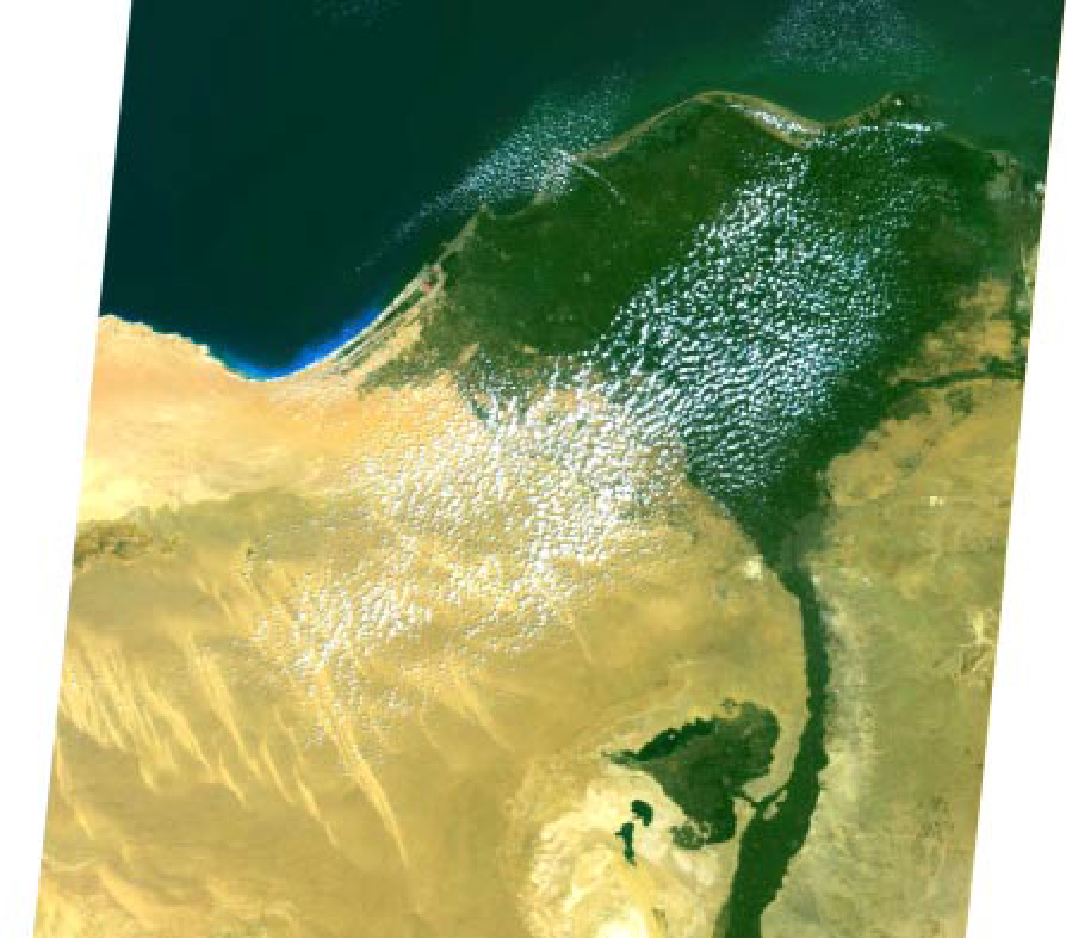
From the above image, El-Askary & El-Ghazawi (2012) say there is a great improvement in image quality (compared to the ultraviolet range). Therefore, scientists may detect dust storms that were difficult to detect under the ultraviolet range using the MISR technique. This ability improves because the MISR technique has a deeper atmospheric depth (Chen, 2004, p. 9). In addition, since the MISR technique may detect small sand storms, it is much easier for scientists to detect smaller storms early. In addition, since the MISR technique incorporates different angles in sand storm detection, it is similarly easier to establish dust clouds from regular clouds. In the same manner, scientists may easily decrease the background effect for desert storms by determining the right angle to take during the imaging process (Chen, 2004). This usually occurs through the combination of spectral measurements at different viewing angles. In fact, if scientists analyzed different storms, it would be easy to determine the right indices for different dust storm intensities. Consequently, it would be similarly easy to establish the right dust storm intensity for detection using MISR data. MISR data normally expose intricate details about dust storm properties (like its thickness, distribution, concentration, and land surface) (Chen, 2004). These details are pivotal in developing a simulation model. Moreover, governments and other agencies may use the available properties of the sand storms for decision-making purposes. Indeed, El-Askary & El-Ghazawi (2012) say, “When the above indices are used dynamically, they could study the development, movement and transport of dust storms for both model simulation validation and for public and government agencies” (p. 2).
Microwave Length
Lastly, scientists may monitor sand storms using the microwave length. For example, scientists commonly use the microwave length to measure water vapor in sand storms (El-Askary & El-Ghazawi, 2012). Normally, this analysis occurs when sand storms act as cloud condensation nuclei that may produce fog or smog when exposed to the atmosphere. Through the diagram below, it is easy to establish how water vapor shifts occur with shifts in sand storms.
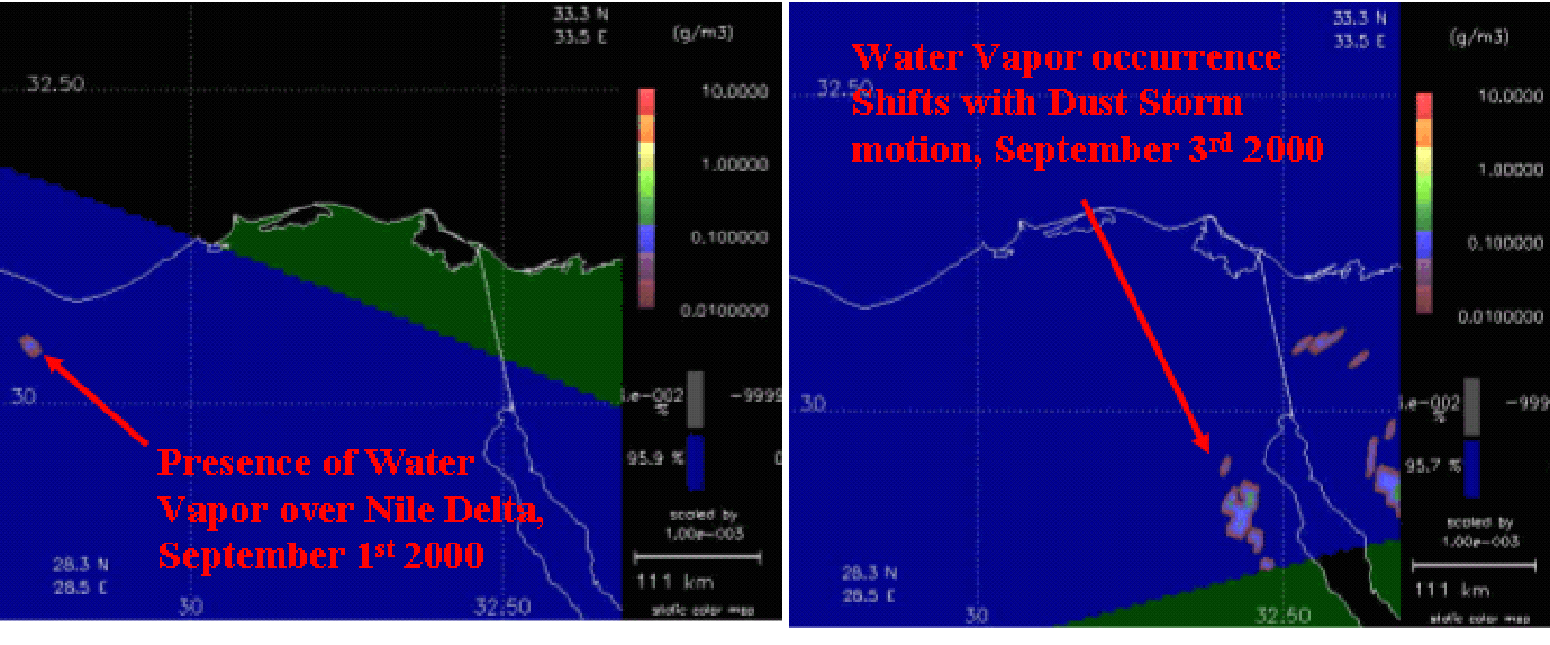
As inferred in the above figure, we see that the position of water vapor and smog shifts in position as the position of the haze and dust storm shifts as well. The microwave length technique helps to identify such shifts, thereby identifying dust storm motions.
Comprehensively, scientists have developed new approaches for detecting and monitoring sand storms in the recent past using global observing sensors. Broadly, the works of the different authors studied above show that when these sensing tools integrate at different spectrums, not only will adequate information about the sandstorms suffice; the physics involved in such sand storms may also manifest. The main challenge that faces many of such sensors stem from the different properties involved in dust storms (such as earth surface features, clouds, and other tiny particles), which provide different image properties when they reflect sunlight. However, the evidences provided in this paper show that multi-angle measurement provide clearer images that show fine discriminations among different dust components.
Quantitative Indicators of Dust into Different Wavelengths
In a study conducted by Kulmala (1996, p. 889) to ascertain the quantitative factors that categorize dust storms into different wavelengths, he established that the physical, chemical, and optical properties of dust particles provided the baseline for identifying the right quantitative indicators of dust. These qualities manifested through the analysis of aerosol concentration, size distribution, and chemical distributions of the different dust properties. In the same analysis, Kulmala (1996) assessed the atmospheric optical components of the dust by analyzing its visibility, optical depth, albedo, and other essential properties. The characteristics of the dust particles and the strengths of the winds that carry it also determined the wavelength categorization of the dust storms. When the dust particles are lighter and the winds are strong, the resultant dust storms are likely to fall in a higher wavelength. The opposite is also true because when heavier dust particles meet with relatively weak winds, it is highly unlikely that the resulting dust storm will be intense. The analysis of these indicators showed that dust plumes played a significant role in reducing daytime temperatures and the profile of night temperatures.
Wind Resources Assessment and Properties in UAE (Abu Dhabi)
A study conducted by Hamza (2011) to measure the atmospheric dust components in the UAE sampled the result findings of about five meteorological stations in Abu Dhabi. The findings showed that the construction of high-rise buildings along the UAE coastline had significantly hindered the transport of dust particles in the country (Hamza, 2011). In this regard, their index of dust storm strength only confined to horizontal visibility. In fact, their visibility index confined to a maximum of 2000 meters or less. The studies demonstrated that a high concentration of dust blanketed the UAE coastal area (Wasimi, 2010). Lower concentrations of dust only occurred during the May-June period. These studies also showed the atmospheric compositions of the dust storms. Hamza (2011) says there have been narrow variations in the mineral compositions of sand storms around the world because most meteorological reports show that the concentration of quartz is relatively high in most parts of the world. However, depending on the source of the dust, Hamza (2011) claims that high concentrations of calcite may similarly register in atmospheric dust.
Techniques for Atmospheric Dust Assessments
The aerosol robotic network (AERONET) is one technique that has been used to measure atmospheric dust components in the UAE. NASA and PHOTONS introduced the AERONET method to improve their atmospheric analysis processes (NASA, 2012). So far, other associated agencies, scientists, and institutions of higher learning have corroborated the work of NASA and PHOTONS in using the AERONET method. Open Source CMS (2013) says “The program provides a long-term, continuous, and readily accessible public domain database of aerosol optical, micro-physical and radiative properties for aerosol research and characterization, validation of satellite retrievals, and synergism with other databases” (p. 4). The main difference between AERONET and other methods of atmospheric dust detection is its ability to standardize processes, calibration, and distribution instruments in the analysis of spectral aerosol depth.
The AERONET model works with a network of ground-based sun photometers that quantify and estimate atmospheric dust components (Open Source CMS, 2013). Normally, the sun and sky radiances provide the right assessment features for understanding atmospheric dust components. The measurement system works through a solar-powered CIMEL technique that measures different wavelengths. Scientists may use ships as vessels for taking such measurements (Open Source CMS, 2013). Scientists may take the measurements at least twice daily (NASA, 2012).
The main advantage of the AERONET method is its ability to provide perfect cloud screened observations in diverse aerosol regimes (NASA, 2012). This advantage shows that the technique has a high quality of calibration that makes it highly accurate. The high accuracy is crucial in helping scientists to analyze aerosols better. So far, scientists have found the technique to be useful in analyzing “cloud formation, climate change and air pollution” (Open Source CMS, 2013, p. 4). Its images have perfect spectral aerosol depth. Open Source CMS (2013) says, “Inversion products are retrieved from almucantar scans of radiance as a function of scattering angle and include products such as aerosol volume size distribution, aerosol complex refractive index, optical absorption (single scattering albedo) and the aerosol scattering phase function” (p. 8). The above products all outline the average aerosol column that is present in the atmosphere (Singh, 2004).
The competencies advanced by the AERONET model have encouraged many agencies to use the technique for meteorological purposes that stretch beyond the understanding of weather patterns. For example, Met Office (2012) (a dust forecasting agency in the UK) explains that it has embraced the technique despite its experience in forecasting operation dust in military activities for many years. Specifically, Met Office (2012) has adopted the AERONET technique to support British and NATO forces as they work in regions that are prone to dust storms. Mostly, the agency uses the technique in dust storm forecasting in South Asia and the MENA region (Met Office, 2012). Similarly, Met Office (2012) has tested the AERONET technique when forecasting dust storm covers in Morocco (the dust storm created a cyclonic circulation of dust clouds from the Moroccan Mountains over Spain and England). The AERONET technique correctly forecasted this dust storm (Met Office, 2012). A similar study conducted by Met Office (2012) (in collaboration with American universities) correctly predicted the atmospheric sand storm components in the Sahara desert.
Scientists synonymously used the SEVIRI data method with the AERONET method to predict dust storms and measure the thickness of aerosol dust in the UAE (Research Centre for Renewable Energy Mapping and Assessment, 2013). At 500 NM wavelength, the following diagram shows the outcome of this process after the Research Centre for Renewable Energy Mapping and Assessment (2013) did a study to measure the atmospheric dust features of the UAE.
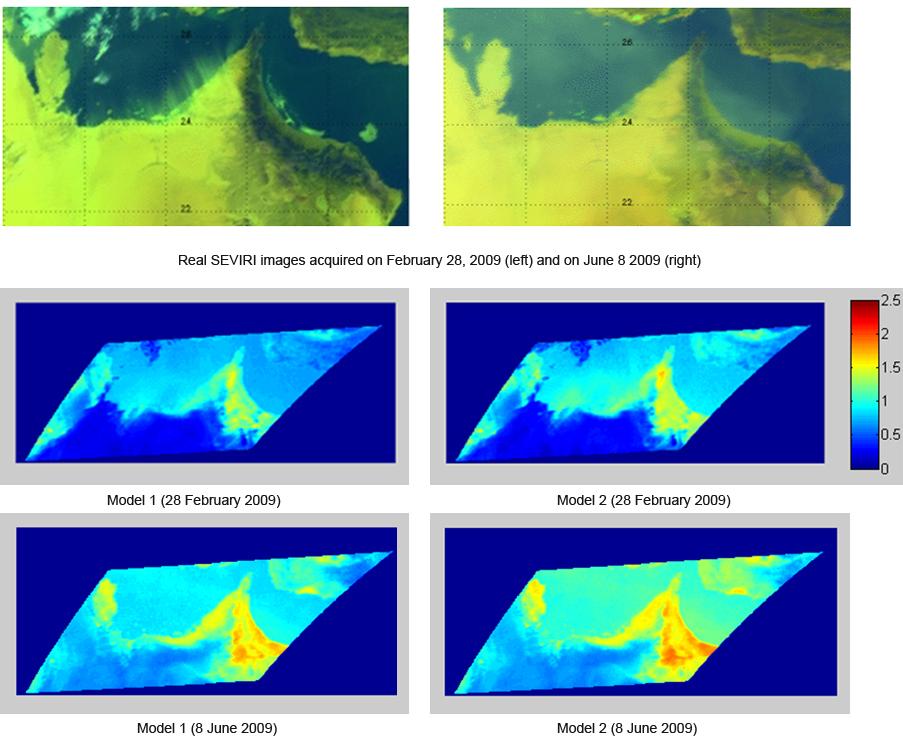
Scientists conducted the tests during two periods (in February and June of 2009). The diagram above shows the different outcomes, but model-1 results show a better outcome than model-2. Implicitly, the use of the AERONET and SEVIRI techniques have become indispensable to the prediction of dust storms and the estimation of aerosol load in the atmosphere.
The UAE Wind Resource Map as Produced using GIS, WindPRO and WAsP Programs
The Research Centre for Renewable Energy Mapping and Assessment (2013) says scientists have used the UAE GIS, WindPRO and WAsP techniques to develop the country’s wind resource map. As explained in the diagram below, the UAE wind speeds are higher during the day than in the nights.
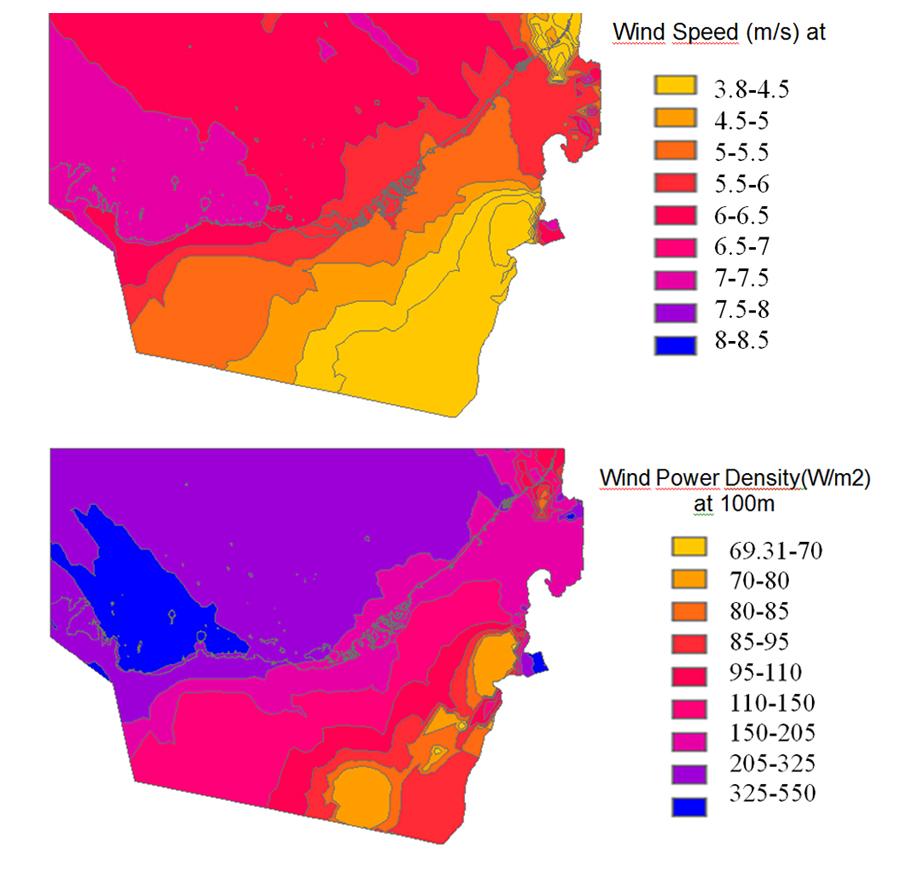
Wind speed variation occurs because of the presence of homogeneously mixed air that exists along the vertical lengths of the atmosphere (Research Centre for Renewable Energy Mapping and Assessment, 2013). There is a strong comparison between low height areas and high height areas because both regions tap different wind strengths. The highest wind energy registers in the northeastern inner region of the UAE. However, the maximum wind potential in the country registers in the coastal areas of the country (Research Centre for Renewable Energy Mapping and Assessment, 2013).
Recommendations/Conclusion
Vegetation and land cover normally influence the intensity and levels of dust storm emissions. Xin (2013) says, “Vegetation and land cover affects dust emissions by altering wind regimes through land-atmosphere coupling, and the surface characteristics that determine the intensity of wind erosion” (p. 4). The impact of vegetation and land cover on dust emission best manifests through the understanding of how severe dust storms occur in arid and semi arid areas (Engelstaedter, 2003). In this regard, Kimura (2012) says that massive deforestation and land degradation outlines the main causes of severe sandstorms in most parts of the world. Through this understanding, a converse understanding of the above statement shows that vegetation and land cover reduces dust emission. Kimura (2012) affirms this phenomenon by asserting that vegetation cover prevents dust outbreaks. However, he says that the threshold for this phenomenon to occur is when the vegetation cover is 20% or more (Kimura, 2012). This finding manifested through a research study in China to ascertain the effects of strong winds and land cover on China’s dust storms (Kimura, 2012). A different study that showed similar findings proved that vegetation cover and geomorphic settings controlled the intensity of dust emissions. The study used storm frequency and visibility measurements (gathered from more than 2,400 meteorological stations around the world) (Kimura, 2012). Scientists registered the highest dust storm frequencies in desert and barren lands (areas that did not have any vegetation) (Kimura, 2012). The intensity lowered in shrubland areas and grassland regions respectively. Through the findings of this study, scientists stress the importance of maintaining a high vegetation cover as a strategy to reduce the intensity of sand storms (Kimura, 2012).
References
Agarwal, A. (2007). Hierarchical pcatechniques for fusing spatial and spectral observations with application to misr and monitoring dust storms. IEEE Geoscience and Remote Sensing Letters, 4, 678–682.
Blackwell, W. (2011). Dust Storms Affect Subsequent Emergency Hospital Admissions, Study Finds. Web.
Chen, Y. (2004). Machine Learning and Statistical Modeling Approaches to Image Retrieval. New York: Springer.
Ecotech Pty. (2013). Dust and sand storm monitoring. Web.
El-Askary, H., & El-Ghazawi, T. (2012). Introducing New Approaches for Dust Storms Detection Using Remote Sensing Technology.
Engelstaedter, S. (2003). Controls of dust emissions by vegetation and topographic depressions: An evaluation using dust storm frequency data. Geophysical Research Letters, 30(6), 26-27.
Gad-el-Hak, M. (2008). Large-Scale Disasters: Prediction, Control, and Mitigation. Cambridge: Cambridge University Press.
Hamza, W. (2011). Dust storms over the Arabian Gulf: a possible indicator of climate changes consequences. Aquatic Ecosystem Health & Management, 14(3), 260–268.
Hillger, D. & Ellrod, G. (2003). Detection of important atmospheric and surface features by employing principal component image transformation of goes imagery. Journal of Applied Meteorology, 42, 611–629.
Kimura. R. (2012). Effect of the Strong Wind and Land Cover in Dust Source Regions on the Asian Dust Event over Japan from 2000 to 2011. SOLA, 8, 77−80.
Kulmala, M. (1996). Nucleation and Atmospheric Aerosols 1996. Sydney: Elsevier.
Kwong, M., & Underwood, M. (2009). Dust Takes Its Toll On Nation’s Health. Web.
Melin, P. (2010). Soft Computing for Recognition Based on Biometrics. New York: Springer.
Met Office. (2012). Enhanced Dust Forecasting Capability. Web.
NASA. (2012). NASA Expands Network for Measurement of Tiny Airborne Particles. Web.
National Research Council. (2000). Issues in the Integration of Research and Operational Satellite Systems for Climate Research: Part I. Science and Design. New York: National Academies Press.
Nicholson, S. (2011). Dryland Climatology. Cambridge: Cambridge University Press.
Nuwayhid, I., & Youssef, R. (2012). Impact of Climate Change: Vulnerability and Adaptation on Human Health. Web.
Open Source CMS. (2013). AERONET. Web.
Research Centre for Renewable Energy Mapping and Assessment. (2013). Dust
Monitoring over The UAR Using the MSG and SEVIRI Thermal Brands. Web.
Rivas-Perea, P., & Rosiles, J. (2012). Dust Storm Detection Trough Moderate Resolution Imaging spectroradiometer: A Machine Learning Problem. Web.
Schmid, J. (2012). The SEVIRI Instrument. Web.
Singh, R. (2004). Influence of dust storms on the aerosol optical properties over the Indo-Gangetic basin. Journal Of Geophysical Research, 109, 1-13.
Wasimi, S. (2010). Climate change in the Middle East and North Africa (MENA) region and implications for water resources project planning and management. International Journal of Climate Change Strategies and Management, 2(3), 297 – 320.
Xin, X. (2013). Examination of the impact of land-cover/land-use changes and climate on the dust dynamics in Central Asia and implications to dryland ecosystems. Web.