Abstract
The purpose of this project is to carry out a comparative analysis of two technologies for polishing Treated Sewage Effluent (TSE) water that is used in District Cooling Systems as a cooling medium. The purpose of using TSE is to save freshwater which is a very scarce resource in Qatar. The analysis is focused on two water treatment technologies: Reverse Osmosis (RO) and Membrane Distillation (MD). The comparative analysis focused on the economical aspect. The methodology that is used to achieve this goal after the problem identification and working on the literature review is to collect the needed data from Qatar University. Using these data, the comparative analysis is developed using the life cycle cost tool to come up with the results that are used to recommend the most cost effective technology.
As a result of this comparative analysis, it is found that the membrane distillation with recirculated water using the flat solar collector is the best. It has an 80% recovery rate and it costs between (1.3) and (1.73) QR m^3/day only.
Introduction
General background
All people all over the world are in high demand for energy for use in various aspects of the lives. For example, energy is commonly needed for industrial and domestic purposes. Numerous countries depend on energy for economic growth such as in the case of Qatar. This paper provides an overview of the technology of direct cooling system as used in various parts of the world nowadays.
In Qatar, the cooling indoor space takes a very high percentage of the total energy consumption because of its hot weather. Therefore, there is a need for a district cooling plant to solve this problem. This is attributable to the fact that a cooling system can provide cooling service effectively and efficiently. Such a strategy can work whereby a central chiller plant is used to produce cold water and then distributes it to the nearest buildings through a network of pipes. It can be implemented in different types of buildings such as commercial offices, residential, hotels, universities, among others.
District cooling is superior to the conventional air conditioning systems that are used by many people nowadays. This is attributable to the fact that this system of cooling has numerous advantages including preservation of the energy by reducing its consumption. Such a strategy ensures that the amount of carbon dioxide that is released to the atmosphere is reduced. In addition, it reduces the amount of money that the government spends in its annual maintenance. Furthermore, it is a reliable system and it satisfies the customer’s need in seasonal variations.
Problem statement
This project focuses on the chiller plant in Qatar University. However, this plant deals with fresh water only for cooling which is a real problem that cannot be neglected. Qatar is considered to be one of the driest and hottest cities in world. For this reason, there is a need for a lasting solution to the hot weather in the region. The adoption of the direct cooling system in the city would significantly help to deal with this problem. Despite this, it appears inappropriate to use a source of fresh water for cooling in Qatar as it is classified amongst the driest cities in the world.
In addition, there is a need to use the district cooling system to reduce the energy consumption while at the same time a lot of energy is needed to produce fresh water as required. That is why Qatar has a new law that governs the use of fresh water in the district cooling system. On the other hand, using the Treated Sewage Effluent (TSE) instead of fresh water can solve this problem of this superior system.
Literature review
The literature review is divided into two parts. The first part will present a general knowledge about the District Cooling System and the second one will include a general overview of the categories of the water desalination processes. In addition, specifying which of these technologies will be the focus of the project as far as treating the TSE water is concerned. The selection and identification of this type of water will also be justified and discussed. Each of the technologies will be elaborated upon in general including to the following aspects: technical, advantages and disadvantages. Finally, both of them will be compared based on some related sources.
District Cooling System
District cooling system (DCS) defines the sustainable approach of the cooling energy distribution using mass production. The fundamentals of the district cooling design include the cooling medium such as water that is generated by a refrigeration plant and then is delivered to the required destination such as buildings via a closed pipe network. The district cooling system also allows circulation of coolants within central cooling plant area and district area. The district cooling systems provide large and collective cooling energy, which is useful in enhancing efficiency in the cooling systems (Gang et al., 2016).
In major regions such as Hong Kong, space cooling is imperative for services in district-wide operations in the year. The system being implemented around the world takes consideration of public utilities, public sectors, and private actors (Kavvadias & Khamis, 2010). However, the increase in the cooling demand due to new facilities, the technology of DCS that reduces the energy consumption, and global environmental policies that reduce the use of greenhouse gases are some reasons for the DCS expansion.
The growth of DCS depends on the design capacity and the use of land allocation in the markets. A controlled flow of the coolant is critical and appropriate in handling space cooling demands that indicate proper installation. DCS uses centralized pumping systems that are meant to reduce the cost of maintenance, as well as simplify operations. However, the centralized pumping approach might not be useful for the promotion of large-scale DCS applications and programs that can withstand the working pressure (Shatat & Riffat, 2012). The provision of pumps is critical for the DCS as far as addressing management problems such as access to rights, and power supply are concerned.
Numerous literature sources and evidence are important in understanding the nature of district cooling system and concepts associated with the DCS in buildings and other areas. Chow, Chan and Song (2004) described the district cooling system and how it applies in different countries. The system works from the centralized chiller plant and ends with the selection of building notes. The DCS comprises of four components including the heat rejection process, the central chiller unit, the distribution process, and the end user. All these elements are critical in understanding the applications of DCS in the society.
The DCS was first used in Colorado in late 1889 for operating automatic refrigerator company. In the 1930s, the Rockefeller Center decided to use the units in its locations. In 1970, the Japanese government and authorities advocated for the use of the DCS towards increasing efficiency as well as lowering pollution. Over 154 units of district cooling systems were in Japan by the year 2005. Thus, there is a need for different countries to adopt DCS in reducing emissions as well as promoting efficiency.
Technology Integration
Technology integration for DCS is necessary and critical in addressing its impacts on the district cooling system. Gang et al. (2016) laud the ability to integrate DCS with sustainable energy technologies. It is possible to integrate DCS with most sustainable energy options in the society. Through the integration of the renewable sources of energy, it would assist in reducing large rates of greenhouse gas emissions into the atmosphere. Chow, Chan and Song (2004) appreciate the ability to use DCS to improve the energy efficiency of fuel. Rezaie and Rosen (2012) and Hart and Rosen (1996) discussed the effect of wasting energy that leads to the increase of greenhouse gas (GHG). This wasted energy will affect health by causing air pollution, acid precipitation and affecting the stratosphere layer. Rezaie and Rosen (2012) explained how to use the increase of heat caused by wasted energy to contribute to preserving the environment. Thermal storage process also benefits from the approach in reducing the levels of energy consumption of the DCS during demand periods (Duke, Mee & Diniz da Costa, 2007). Thus, the integration of the DCS with sustainable energy tools will assist in promoting efficiency and lowering emissions into the atmosphere (Summers, Arafat & Lienhard, 2010). Most importantly, Chow et al. (2004) urge the need to use DCS and biomass technology to promote energy saving. Such technology helps in reducing the level of greenhouse gasses and still contributes to the expansion of biomass energy. The optimization of DCS with biomass also improves the supply chain efforts and programs in the organization.
System Optimization
System optimization of DCS is appropriate in promoting the design of the DCS to promote connections between the systems. Existing studies by Chow et al. (2004) notes show that DCS design optimization can address the water distribution networks issues. The central plants and its users would be well connected through the chilled water network. The connection could be made in various ways using the isolation with the heat exchangers.
The direct connection of the systems will involve pumping chilled water from the central plant to the inbuilt air conditioning processes. This connection is considered to be more economical and efficient to eliminate the heat exchangers and the related equipment and systems. The chilled water networks can also be arranged in tree shaped networks. Such indirect and direct networks are appropriate in promoting the optimization of the DCS system.
Challenges and Opportunities for Applications
The expansion of DCS faces various challenges. Despite this, some opportunities are associated with its applications. According to Gang et al. (2016), DCS has an opportunity to improve energy efficiency if used in evaluating the performance of DCS in the CCHP programs. The DCSs elements are usually integrated into the CCHP processes to improve electrical performance as well as enhance the single effect and double effect chillers’ performance.
A research carried out by Gang et al.(2016) shows that it is appropriate to use reports from energy analysis to determine and compare the various options such as electricity, heating and cooling generated from the different processes have different qualities and metrics.
The DCS integrated into the CCHP processes improves the efficiency and meets the cooling and heating demand for users. In most occasions, the integrated process applies in regions dominated by the heat. On the other hand, the DCS acts as an additional process, which is critical in obtaining the cooling demands. The challenges associated with the adoption of the DCS are that there are limited resources and evidence regarding the performance of DCS after integration with CCHP systems.
Summary
In summary, the paper aimed to present a review of existing research and assessment of applications of DCS with diverse energy technologies, and operation optimization. The purpose of the paper was to assess the use of DCS in promoting energy efficiency as well as promoting urban development. The paper offers difficult scenarios and discussions about the actual scale of energy modeling through DCS. The problem encountered during the study is associated with the inefficiencies in the heating and cooling process using different systems.
The effort to address the poor system performance is the main goal of the research paper. It also sought to determine the measures that can be used to reduce the operating costs and energy consumption in the organization (Meindersma, Guijt & de Haan, 2006). Some of the recommendations and conclusions obtained include that the DCS can be integrated with renewable sources of energy. Such an approach would help to improve the cooling and heating processes. The operations on DCS design is assessed based on a global perspective, which is critical in design optimization and practical applications. The control optimization of DCS is necessary for its implementation. For example, multi-objective nonlinear programs approach can be used to assess the various implications of the district cooling systems. The results indicated that the DCS is useful in improving the overall energy consumption as well as saving costs within an organization. The identification of the optimum DCS units relies on the screening process of different options, assessment of users, and the selection of heat rejection tools.
The research outcomes also suggested that the different measures could be used to reduce the energy consumption of the DCS including the circulation of chilled water, using outdoor aid for free cooling, reducing outdoor air intake depending on the demand for ventilation and the reset of indoor temperature levels. The integration of DCS with sustainable energy tools will assist in enhancing efficiency and lowering the amount of harmful materials released to the atmosphere. The society must understand the use of DCS in addressing energy efficiency issues within the cooling and heating processes.
The district cooling system provides large and collective cooling energy, which is useful in enhancing energy efficiency in the production and cooling systems in organizations. District cooling systems could be used in an urban environment due to its ability to reduce emissions. However, it always requires an environmental impact assessment to be conducted to understand the suitability of the environment to perform heating and cooling services.
Water Treatment Technologies: Overview
The water distillation technologies are generally classified various categories: thermal processes (e.g., multi-effect distillation (MED), membrane distillation(MD) and mechanical vapor compression (MVC) and thermal Distillation) and membrane processes such as reverse osmosis (RO), nanofiltration(NF) and electrodialysis [ED] (Gökçek & Gökçek, 2016). However, this project focuses on the treatment of sewage effluent (TSE) by these two technologies: Reverse Osmosis (RO) and Membrane Distillation (MD). The main reason to choose these two technologies is because of the popularity of Reverse Osmosis technology in the field of water distillation and the Membrane Distillation is a promising technology that requires less energy.
Treated Sewage effluents (TSE) water
TSE water is the treated waste water that comes from the daily usage of urban residents and industrial water discharges. This water is treated and hence, it can be used in many useful activities and different applications such as urban, agriculture and industrial applications. It is necessary to mention that the TSE water is better than sea water desalination because it is cheaper and it has a lower water production cost.
Reverse Osmosis Technology (RO)
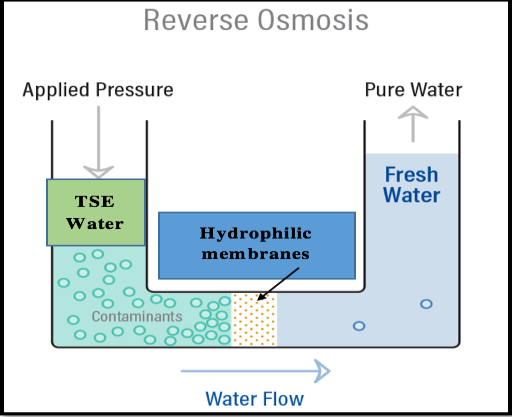
Reverse Osmosis is one of the most popular technologies in the water treatment processes. It is used in many regions in the world especially in remote islands such as Greek Islands, Maldives, Canary Islands and Seychelles, as well as in some of the African and Middle Eastern countries (Atikol & Aybar, 2005). Reverse Osmosis is the process of purifying the water from any contaminations through applying a high pressure on it to force the water to flow through a hydraulic membrane. Mainly these types of membranes which are considered to be semi-permeable allow only the water to pass and prevent the salt or any other contaminations from passing through it (Kesieme et al., 2013). It has a high ability to produce high quality water as a final product.
RO is used in many different types of applications such as separation, purification and concentration processes. For instance, it is applied in the food industry as a concentration process for the concentration of fruits, vegetable juices, and pre-concentration of milk. In addition, it can be applied in any area that has a huge source of peat water to produce clean water for community use. Furthermore, wastewater treatment is one of the RO applications that are achieved as the process can reuse this type of water for many applications. Reverse osmosis prepares wastewater for direct consumption if it is used as a polishing step for the secondary or tertiary wastewater effluent. This application is considered as the final and real valuable step for the RO technology. However, the largest application of RO is in the production of potable water from desalinating seawater and brackish water. All of these applications are very useful but at the same time, this technology has many limitations such as membrane fouling, membrane durability, low permeation flux and high economic and operating cost that make the technology uneconomic (Warsinger, 2015). Notably, fouling is and one of the significant problems in membrane applications because it influences the operation and maintenance cost in addition to the capital investment. In addition, the membrane efficiency is a serious challenge for the membrane processes like RO. Moreover, the RO has a high-energy consumption which drives the high pressure that is considered is a major contributor to total cost.
Energy is needed not only as a power supply for the high-pressure feed pumps but also for the membrane units. It is also required for other pumps, chemical dosing plats, and auxiliaries. As a result of its energy intensity, it is not a viable solution in the regions where there is a low supply of electricity (Alklaibi & Lior, 2004). On the other hand, there are continuous attempts to use a renewable resource for the RO plants to lower the cost of energy consumption needed to run the system.
The use of wind-powered desalination plants is considered to be a sustainable method to provide fresh water in isolated raids and coastal zones in Turkey, which is a technical and economic assessment of producing fresh water using a small scale seawater RO system that is powered by the wind. The result shows it is reasonable for the site technically and economically. In addition, such an approach can reduce CO2 emissions annually when using wind turbines to operate a Reverse Osmosis system.
Moreover, RO has a major disadvantage related to the environment in that it leads to large amount of discharge (Dysert, 2003). The Reverse Osmosis concentrate (ROC) is a result of the process that is full of dissolved organics, inorganics, and persisting organics pollutant. This type of discharge is really dangerous on the human and ecological health because of its improper contents such ad a high concentration of rejected compounds. So that the amount of ROC wastewater requires cleaning and disposal to minimize the discharge as much as possible trying to reach near–zero discharge (Shanmuganathan, 2016).
Membrane Distillation Technology (MD)
The membrane distillation process is a thermally driven process that provides potentially a cost effective water treatment technology especially when paired with one of these energy sources: waste heat, solar thermal or geothermal heat sources (Alkhudhiri, Darwish & Hilal, 2012). This technology is not very old like the Reverse Osmosis (RO) process. In the 1990s, there was a growth in this area of research and development. Membrane distillation process has gained more attention and it has become more competitive in the remote area especially in the developing countries that require small-scale applications such as the systems that are driven by solar source (Warsinger, 2015).
It is important to mention that the solar system is one of the strong points for Membrane Distillation process. However, if a desalination technology (solar versus non-solar) will be selected based on one factor which is the capital cost, the solar system will not be chosen and will be a non-common choice. The reason is that the initial cost for non-solar system is relatively small and the annual cost of operation is relatively large. However, the solar system has an expensive initial cost but the non-energy solar cost during their lifetime is negligible (Al-Obaidani et al., 2008).
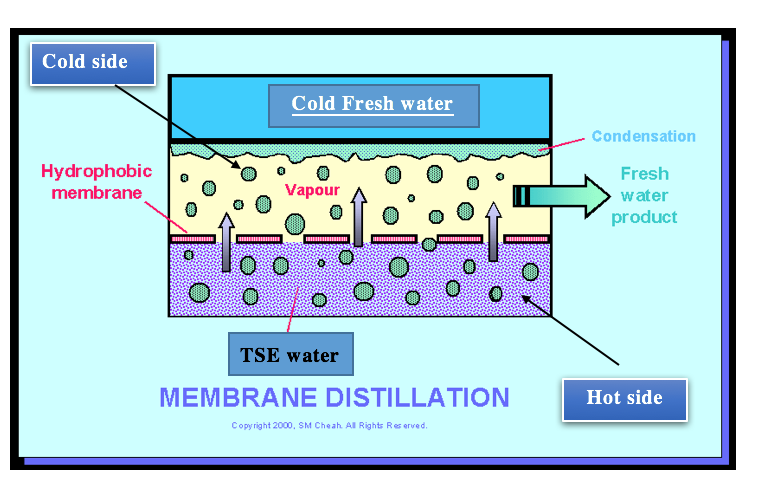
Membrane distillation is a separation process that treats the water by heating it until it turns to water vapor, then only the vapor molecules pass through the microporous hydrophobic membrane to condense to fresh water. This process is driven by the vapor pressure difference existing between its membrane surfaces (Alkhudhiri, Darwish & Hilal, 2012). The main feature of the hydrophobic membrane is that it prevents the water flow and dissolved ions to pass through it and allow only the passage of water vapor and gasses. This feature confirms that high salinity brine can be treated by the membrane distillation process because water vapor does not carry any salinity with it (Minier-Matar, 2016).
There are four configurations for the Membrane Distillation technology that are classified and categorized depending on the nature of the cold side of the membrane: Direct contact membrane distillation (DCMD), vacuum membrane distillation(VMD), air gap membrane distillation (AGMD) and sweeping gas membrane distillation (SGMD) (Alklaibi & Lior, 2004; Minier-Matar, 2016). Membrane distillation can be used for different types of applications such as wastewater treatment, desalination and wastewater treatment. Moreover, MD has advantages compared to the other conventional desalination processes (e.g. multi-stage flash (MSF), Reverse Osmosis (RO) and the Multiple Effect Distillation (MED)). If compared to the MSF and MED, it has a lower operating temperatures and the required vapor space is smaller (Hausmann et al., 2011). In addition, it has a lower operating cost than Reverse Osmosis (RO) and the high osmotic pressure or concentration polarization is not a limitation for the MD performance. On the other hand, it rejects the non-volatile solute by 100%.
Interestingly, these attractive features encourage the use of the MD technology worldwide, particularly when combined with solar energy and low-grade heat source Al-Obaidani et al. (2008). Furthermore, using Membrane Distillation has some critical advantages over the other processes such as the ability to use cheap membranes, its product quality is higher than RO, the resistance to fouling is higher than other processes and the compactness of the system is high. Despite this, the membrane distillation is still an emerging process which has some challenges associated with it such as system optimization and limited experience on scale up (Minier-Matar, 2016). Also, an industrially long life for the membrane is not ensured yet (Khayet & Matsuura, 2011).
Summary and Comment
After looking for many journals and books in different databases to find an economical assessment comparing both Membrane distillation and Reverse Osmosis, only a few sources are focusing on the target point. Khayet and Matsuura (2011) do not only compare these two technologies with each other but also compare other different technologies based on the same criteria. It is comparing the water production cost (WPC) of MD and RO process for treating seawater of 105,000 m3/day based on energy costs (heat costs and electricity costs), fixed costs (hardware costs, module costs), and auxiliary costs (chemicals, filters, etc.). The target of this comparison is to investigate which of these technologies has the lowest water production cost (US$/m3). As a result of this comparison, the MD has much lower cost than RO because it does not require a high-pressure pump. However, the cost of the MD modules is higher. Overall, the total fixed cost and O&M costs for MD are lower than RO.
The factor that can make the energy costs of MD lower when compared to RO is the availability of the waste heat. For MD the unit water cost will decrease from ($0.26/m3) to ($0.1/GJ) if the cheap waste heat is available. Alklaibi and Lior (2004) discuss a different type of comparison between RO and MD which did base on their cost and production rate for a fixed membrane area. The estimated cost of water production ($/m3) for RO is 1.25 $/m3 which is lower than the MD water production cost (1.32 4/m3). It is mentioned that the cost of any desalination process varies with respect to the different conditions such as the location, the type of water and the nature and the size of the plant. Alklaibi and Lior (2014) mentioned that numerous driving cost parts of MD are not yet known because the process has not been applied in a commercial size to have the money saving advantages of large scale manufacturing; nor are variables, for example, penetrate flux, pretreatment, fouling and membrane like is not known enough yet. Khayet and Matsuura (2004) and Alklaibi and Lior (2014) compare both MD and RO using different ways but the type of water is the same type of water which is the seawater.
In this project, a comparative analysis will be done between MD and RO. However, the assessment will not focus on the economical aspect only but also on the environmental and technical aspects. This project will focus on the use of the water treatment technologies to treat the TSE water not seawater because the main aim is to provide quality water that can be used in the District Cooling System, as this forms the main difference between what will be done and what has been already done. However, there is a similarity between the case of Qatar University and the comparison that is done by Khayet and Matsuura (2011). Both of the cases focus on the large scale water treatment process. In addition, the energy costs components that are used to do the comparison will be used in the cost analysis part of the project.
Model Development
This chapter describes the existing District Cooling System (DCS) and explains the solution provided to solve the problem of using fresh water.
Existing Model of Qatar’s University District Cooling system
The District Cooling System in Qatar University provides the cooling services to all the existing buildings through two main operational chillers. However, there are two other chillers will be operational by 2018 to serve the new buildings in Qatar University as shown in figure 1 above. This is because there is an expansion in the construction of Qatar University due to the increased number of students and their needs. So, each of these chillers serves some of the buildings in Qatar university by cooling the fresh water, and pumping it to the building through a pipeline network. Then after using this chilled water to cool the air, it becomes warm and gets back through the same pipeline network to be cooled again in the chiller. Notably, this is a closed loop system and the water is recycled each time. However, during the cooling process, a huge amount of water evaporates from the cooling tower.
Cooling towers
As shown in figure (2), hot water is sprayed using spray nozzles inside the cooling tower. The cooling tower allows this warm water to make direct contact with the air to be cooled. Because of this direct contact, a huge amount of water evaporates that needs to be recovered.
Daily consumption of fresh water
Recently, the total amount of water lost by using two chiller plants is 4800 m3/day. However, this amount will reach 9800 m3/day in 2018 when the university will run the new two chillers. Kahrama (Qatar General Electricity and Water Corporation) which provides the fresh water needed for the companies and institutes supplies this huge amount of water every day.
Summary
Water is a real critical problem in a dry country like Qatar. The only source of fresh water is desalinated sea water which cost Qatar a lot of resources in terms of money. The fresh water should be saved for people instead of using it in cooling, especially considering that the population in Qatar is increasing. The continuous increase in the demand requires more desalinated sea water. There should be an alternative solution for this problem.
Developed Model of Qatar’s University District Cooling system
This project aims to solve the existing problem of using fresh water in the District Cooling System by finding suitable alternatives such as the use of the Treated Sewage Effluent water (TSE water). This type of water is available and much cheaper than the fresh water since it can be bought from the Public Works Authority ‘Ashghal’. However, the District Cooling System in Qatar University is designed to deal only with fresh water. So, TSE water cannot be used directly in the system. It should be treated first and then pumped to the chiller plants. In addition, people will be affected if the TSE water is used directly without pretreatment because of the presence of bacteria.
If TSE water is used directly to the chiller plant, there will be a need to cool it. The cooling tower has an open top, which can affect the surrounding area. The implication is that there is a need to polish this water and develop a model that includes a desalination plant. As shown in figure (2), a desalination plant will be built to treat the TSE water before using it directly in the chillers. It is treated to protect the system from being ruined and damaged.
Desalinating TSE water can be done by different water treatment technologies. However, the focus of this project is developing a comparative analysis between the Reverse Osmosis technology and Direct Contact Membrane Distillation.
Reverse Osmosis Technology
Reverse Osmosis technology is very popular in the water desalination field. As shown in figure (3), it is driven by high pressure that pushes the water flow through the hydrophilic membrane. This membrane allows the water only to pass without any contaminations. Usually, electricity is used to run the system because the high pressure and pumps need huge power.
Direct Contact Membrane Distillation (DCMD) Technology
Direct Contact Membrane Distillation is one type of the membrane distillation technology. This type is better compared to the other membrane distillation technologies especially in the desalination field. The use of DCMD is preferred over other MD technologies because it is simpler which means it needs less maintenance. In addition, it is cheaper because no external cooling surface is needed to condense the vapor.
As shown in figure (4), the TSE water will be heated to 60 C and enter the hot side in the membrane. The vapor only passes through the hydrophobic membrane to be condensed in the cold side to produce fresh water. This technology is thermally driven and the required temperature is only between 500C and 700C. This is the reason why solar system can be used to heat the water to complete the treatment process.
This project will consider that the water will be heated using the evacuated solar collectors or the flat solar collector. Figure (5) and (6) describe the flow of TSE water from the starting point until it reaches the last stage. Figure (5), represents the direct contact membrane distillation plant that has 40% recovery rate. This recovery rate means that 40% from the treated sewage water will be desalinated reaching the required level of purification and 60% is a high concentrated water (brine disposal).
However, figure (6) shows the same system but with a modification to increase the recovery rate to 80%. The Membrane Distillation technology is driven by heat, and the brine water can be heated again to treat it and get more fresh water. The modification in this system is about recalculating the brine water. Because of this modification, the recovery rate will be the double using the same membranes with no extra cost and the disposal will be only 20%.
Constraints
Assumptions
It is important to draw attention to some of the assumptions that have been taken into account in this project. The following are some of the assumptions that are related to the DCMD plant:
- The membrane replacement for the membrane distillation plant will be done every three years similar to the RO, because both need pretreatment to make the membrane last as long as possible.
- The cost of membranes used for Direct Contact Membrane Distillation (DCMD) constitutes 90% of equipment cost.
- Water will be needed during the morning hours: The demand of the desalinated water will be used to fill the evaporating water in the morning when the sun is present in the sky. This is because during the night, the evaporation rate will be very small.
- The useful lifespan of the plant is 30 years implying that the residual value will be 50% after 15 years and 33% after 20 years of the plant life time.
- Annual Operation cost will increase a specific rate each time is ( 3%, 5%, 7%, 10%) for a specific life time
Design Methodology
Life cycle cost
Life cycle cost is one of most effective approaches that is used in analyzing available options especially in the economic aspects that affect undecided as well as costs in the future. It takes into account all expenses of buying, keeping, and disposing of a building or building system’s equipment.
Concerning the application of life cycle costing, it is important to indicate its use in organizations with large and developed infrastructure. It is becoming increasingly difficult to ignore the fact that the district cooling system for large assets is affected by external influences in a number of ways. Temperature changes, a need for a faster pumping of water, maintenance, and environmental effects determine the costs, which are often unallocated. As a result, many organizations conclude that district cooling is not worth such substantial investment and it does not save power consumption. It is certainly not true, as such companies fail to consider external constraints, which are included in the life cycle costing approach. The flexibility of cost distribution is important, as long as it underlines the value of the entire direct cooling system. The main concern is based on the fact that it is necessary to decide what technology for TSE water is more cost-effective within 15, 20, and 30 years run: Membrane Distillation or Reverse Osmosis.
Life cycle costing model enables to identify these expenses, so that deployment of LLC for this project is relevant. To be more specific, measuring of these costs is possible throughout calculation of its net present value and independent constraints, which are largely present within the entire life cycle of district cooling system.
Main constituents of life cycle cost
- Initial cost
- Investment costs that begin at the start of the analysis period
- Cost are those expenditure incurred after plant commissioning and during actual operation
- Replacements of building systems depend on the estimated life of the system and the length of the study period
- Residual value equals the future value at the end of any period of consideration with respect to the present times.
Net present value
CF0: Is an overall amount of investment for a district cooling system( initial cost) subtracted by the residual value (R) = I0-R
CFn: Is a net cash inflow during a certain period which the asset is deployed, operating, and provided with required maintenance
r: Is a discount rate
T: A particular period R = the residual value

Discount rate
Inters rate = 5%
Inflation rate = 2.2%
Residual rate
When using life cycle cost tool to compare between different alternatives, the net present value (NPV) of each alternative should be calculated. The net present value (NPV) helps when deciding to choose which one of them is the best choice. Moreover, this project is comparing the life cycle cost of two different water treatment technologies: Reverse Osmosis and Direct Contact Membrane Distillation. Each one of these technologies has its direct capital cost and different total operation and maintenance cost which will affect their net present values.
For this comparison between these two technologies, there are three scenarios for the life cycle time of plant are done: 15 years, 20 years and 30 years.
In addition to that, it is impossible to have the same operation and maintenance cost in the 30 coming years. So, it is assumed that the annual operation and maintenance cost will increase by 3%, 5% 7% and 10% each time.
Finally, assumed the useful of the plant 30 years so if we would like to stop using the plant after 15 years we will get back 50% of the initial cost and if we stop using the plant after 20 years we will get back 33% of the initial cost.
Nevertheless, it is necessary to provide an account of each component that contributes to life cycle costs of RO. To calculate the initial cost and O&M cost we have to calculate the relevant costs that are related to the direct and indirect cost. Table 1 provides overall cost for Ro system
Methodology Designed for DCMD plant cost analysis
Calculating the Daily TSE water needed to be treated (Qf)
This formula is used to calculate the Recovery rate using the amount of product water and feed water. However, the case of this project is different. The amount of product water flow rate and the recovery rate is known, but the TSE amount is unknown. It is important to mention that this amount of TSE water will be the same for the Reverse Osmosis (RO) plant and the DCMD plant.
R= 100% * (Qp/Qf)
Qf = (100*Qp)/R
R = Recovery Rate in (%)
Qp = product water flow rate (m3/day)
Qf = feed water flow rate (m3/day)
Direct Capital Cost
This cost including the cost of TSE water, pretreatment, feed pumps, membranes and the cost of evacuated tube collector
Cost of DCMD feed pumps
Cost of feed pumps (QR) = (4.78*10-6) *(Qf/R)*P
P = total pressure (Pa)
Cost of membranes
Membranes Required Area (m2) = (Qf*1000/24)/N
⍴ = water density = 1000 (kg/m3)
N= Transmembrane Flux =6.01 (Kg/m2*hr.)
Cost of Membranes (QR) = membrane required area(m2) *membrane cost (QR/m2)
Cost of Evacuated Solar Collectors(ETC) and flat collector
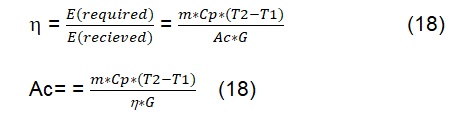
η = the efficiency of the Evacuated tube collector
m = mass flow rate of the heat transfer fluid (kg/s)
Cp = Specific heat capacity of the collector heat transfer fluid (J/kg.C)
T2 = Temperature of the heat transfer fluid leaving the Evacuated tube collector (C)
T1 = Temperature of the heat transfer fluid inside the Evacuated tube collector (C)
Ac = useful area of the Evacuated tube collector (m2)
G = solar radiation (W/m2)
Cost of ETC (QR) = ETC required area(m2) *ETC cost per unit area
Operation and Maintenance Cost
Membrane Replacement cost
Membrane Replacement cost = 0.15*membrane costs (18)
Cost of Electricity
Cost of Electricity (QR/yr.) = electricity cost/m3*annual electricity consumption (18)
Cost of Chemicals
Cost of chemicals (QR/yr) =specific chemical cost /m3 *annual plant capacity (18)
Cost of spares
Cost of spares (QR/yr) =specific spares cost /m3 *annual plant capacity (18)
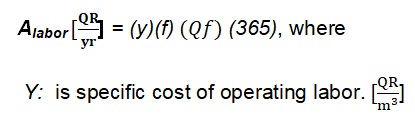
Cost of labor
Cost of labor (QR/yr) =specific labor cost /m3 *annual plant capacity (18)
Cost of TSE water
Cost of TSE water (QR) = 0.30 (QR) * Qf (18
Cost of pretreatment
Cost of Pretreatment (QR) = 0.069 (QR) * Qf (18)
Methodology Designed for RO plant cost analysis
Direct Capital Cost
It is relevant to mention that direct costs should be also included, as they comprise the initial expenses for the asset. They are determined with a certain pricing for interchangeable items of direct cooling system: cost of intake (TSE), cost of pretreatment, feed of pumps and equipment.

Cost of equipment
The total cost of RO system equipment includes membrane cost.
Operation and maintenance cost
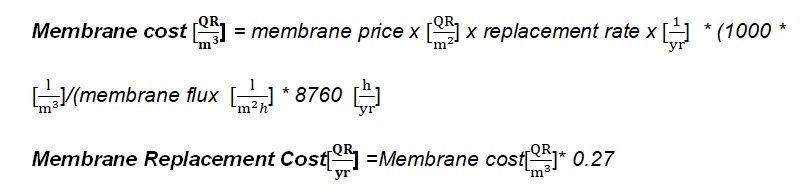
Membrane Replacement Cost
This formula is based on such constraints as flux principle, membrane cost with the pricing per each square meter, and 27% of replacement per 3 years. In such a way, the overall cost of membrane replacement is calculated. These expenses can be calculated in the following way:
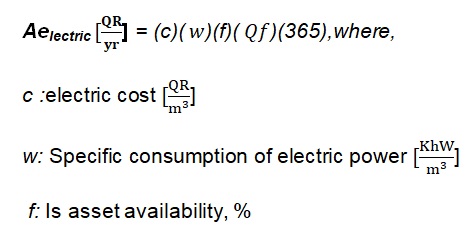
Annual Electric Power Cost
Since electric power consumes ¾ of RO cost It is becoming increasingly apparent that expenses on electric power should be also considered. Therefore, the equation for the annual electricity expenditures is the following:
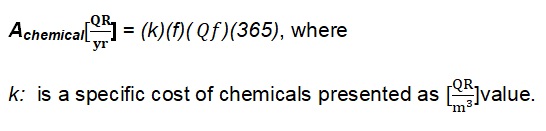
Cost of Chemicals
This aspect is also critical because its depend on the amount of chemicals that needed in to clean desalination plants including sulfuric acid, caustic soda, various anti-scalants and chlorine as well as chemicals treatment for thermal and membrane process.
Annual Cost of Labor
Needless to say, RO as well as the entire asset should be operated with a certain labor, and these expenses should be accordingly calculated via
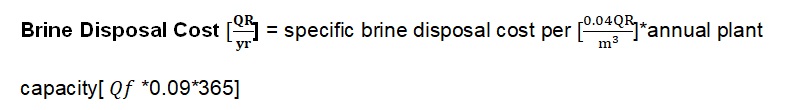
Brine Disposal Cost
Is the amount of water that has not been desalinate? We can identify the Brine Disposal Cost by:
Spare cost

Cost of RO pretreatment

Cost TSE water

Membrane desalination and reverse osmosis results
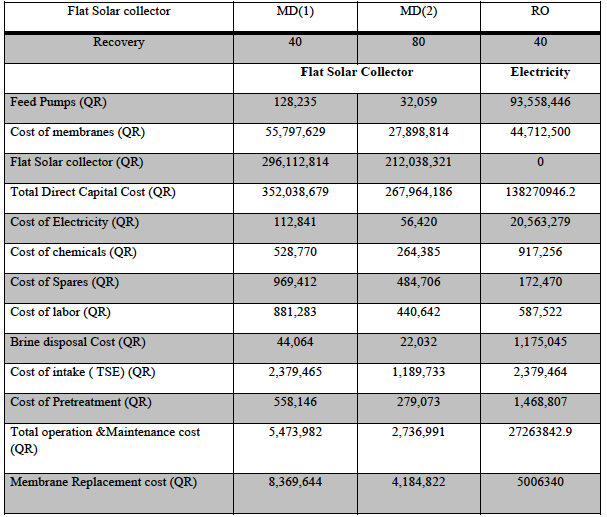
The second table shows the comparison result between membrane desalination using flat solar collector with recovery 40% and recirculating membrane using flat solar collector 80% and reverses osmosis with 40%.
Life cycle cost analysis and results
The results of the life cycle costs represent the cost of the plant during specific life cycle when considering the assumptions of increasing the annual operation and maintenance cost by specific constant rate. But, the target of the project is calculating the cost of the daily consumption of the polished treated sewage water (24,500 m3/day).
Comparison Between different Desalination Technologies using 40% recovery.
In the first case, we assume the life cycle for the plant is 15 years.
From the above graph, the x-axis represents the different estimations made about the increasing rate of operation and maintenance cost per year. The values on the x-axis range from 3% to 10%. On the other hand, the y-axis represents the total amount of the total daily consumption of water. On average, the amount of water used per day is 24500Qr m3. An intensive review of the graph above reveals that when the life time of the plant is 15 years (the plant’s lifespan is 15 years, after which it can wither, dry up or get cut), and the recovery percentage for all desalination technologies is 40%; the cost of the three different technologies fluctuates (rises or falls). For example, determining the membrane desalination of the plant using the evacuated solar collector gives the highest value of water consumption, with having to take as much as 4.684Qr m3 per day. Next in line is reverse osmosis, which requires a maximum of about 3.51 Qr m3 in a day. Lastly, the plant’s lowest value of water consumption in a day is 2.5 Qr m3.
In general, comparing reverse osmosis to Membrane Desalination depends on using either flat or evacuated solar collector. If one compares the two using the evacuated solar collector, then reverse osmosis becomes the best option because it will incur the lowest cost. However, when using the same combination with a flat solar collector, the membrane desalination becomes the most preferable bet as it has the lowest price in this case. Here, the type of Solar Collector plays an integral role on the option to select because it determines the cost. Depending on this evaluation, both Flat and Evacuated Solar Collector could raise or lower the price of an option one selects. For example, Evacuated Solar Collector leads to a lower cost if used with Reverse Osmosis, but would become costly in the case of Membrane Desalination. On the other hand, Flat Solar Collector leads to a lower cost if used with Membrane Desalination, but would become costly in the case of Reverse Osmosis.
The above graph also shows a direct proportionality between the variables of the x-axis against those of the y-axis. In particular, the cost (QR m3/day) increases with a rise in the Rate of Operation and maintenance.
In the second case, we increase the life time to 20 years.
Just as the above graph shows, among the four increasing rates of operation and maintenance cost of the technologies per year (shown on the x-axis); the patterns of three of them were noticeably different. The Membrane Desalination using Evacuated Solar Collector has the highest cost with a value of 4.2 QR
/day, whereas the second highest values (3.2 QR m3/day) is the one using Reverse Osmosis. Lastly, the Membrane Desalination using Flat Solar Collector occupies the third (last) spot with a maximum cost 3.27 QR m3/day
In the third case we assume the life time of the plant =30 years.
A review of the above graph reveals that the membrane desalination using evacuated solar collector is the worst option while using a combination of membrane desalination and flat solar collector is the best bet. Another noticeable different case in the above graph is that when the cost decreases proportionally to an increase in the life time of the plant. An intensive analysis of the three cases reveals that changing both the increasing rate of operation and maintenance cost and the life time of the plant at the same time is not appropriate as it gives the same results as using membrane desalination using flat solar collector.
Comparison between different Desalination Technologies using 40% recovery with developing design
The following tables show the data used to compare various desalinations, assuming different life time of the plant (15, 20 and 30 years), with four different assumption increasing rates of the operation and maintenance cost.
A review of the above graphs gives a systematic set of results. For example, one can conclude that Reverse Osmosis (RO) and Membrane Desalination with 40% Recovery (R) are higher than Recycled Design (RD) at the same rate. For that reason, Reverse Osmosis and Membrane Desalination with 40% Recovery and the recycle are the best options. However, when one compares the two development designs, it turns out that using membrane desalination with flat solar collector is better than using it with evacuated solar collector.
At the end if we choice the worst design which was membrane desalination using solar collector with 40% recovery is better than using fresh water.
Ethical Issues and Responsibilities in the Project
The authors should describe all ethical issues and responsibilities in engineering work in the project as engineers. It is very important to understand ethical responsibility for any engineering work as engineers. Therefore in this section, they should describe their understanding of ethical issues and responsibilities they faced during the project work, and the approach they used to prove their understanding of ethical issues and responsibilities in their engineering work. They may add any suggestion or idea on this matter too.
Professional Aspects Considered and Used in the Project
The goal of this project is to polish the treated sewage water (TSE water) using the most efficient and cost effective water treatment technology. It has taken into consideration the level of purity that the water should reach to be accepted by the chillers. This is because if the water does not reach this level, it will affect the chillers and damage them.
Some standards should be taken into consideration when testing the treated sewage water after polishing.
Conclusion and Recommendation
Conclusion
This project focused on comparing two different water treatment technologies: Reverse osmosis (RO) and Membrane Distillation. The comparison is based on the cost analysis for each one of them by calculating the life cycle cost and making difference assumption about the life cycle and the annual increase in the operation and maintenance cost. The first comparison is between the Reverse Osmosis with Membrane Distillation that has a 40% recovery using the flat solar collectors and Membrane Distillation that has a 40% recovery using the evacuated solar collectors. In this comparison, it is found that the most cost effective one is the membrane distillation using the flat solar collector. Moreover, there was another main comparison that includes the same technologies in the first comparison in addition to the Membrane Distillation with the recirculating water (80%) using both evacuated and flat solar collector. We found that using recirculate membrane distillation is winner, but if we want choose between the Membrane Distillation with the recirculating water (80%) using flat solar collector is the best with different cost approximately 50%.At the end using TSE water with the worst technology such that using membrane distillation using evacuated solar collector with 40% recovery it will cost around 624,750 Qr per month. While buying fresh water will cost almost 3,000,000 Qr per month.
Recommendation
It is recommended to use the Membrane Distillation with the recirculating water (80%) using flat solar collector.
Limitations
- MD is still in its infancy. It is not a mature technology. Its reliability and durability are still unknown.
- The design that has been done in this project, cannot be extended to a facility that needs to be cooled by night (like a shopping mall) because the evaporation that occurs by night is ignored.
Future work
- Considering the increase in the electricity cost
- Considering the demand at night
References
Alkhudhiri, A., Darwish, N. & Hilal, N. (2012). Membrane distillation: A comprehensive review. Desalination, 1(287), 2–18.
Alklaibi, A.M. & Lior, N. (2004). Membrane-distillation desalination: Status and potential. Desalination, 171(2), 111–131.
Alobaidani, S., Curcio, E., Macedonio, F., Diprofio, G., Alhinai, H., & Drioli, E. (2008). Potential of membrane distillation in seawater desalination: Thermal efficiency, sensitivity study and cost estimation. Journal of Membrane Science, 323(1), 85- 98.
Atikol, U. & Aybar, H.S. (2005). Estimation of water production cost in the feasibility analysis of RO systems. Desalination, 184(1–3), 253–258.
Chow, T., Chan, A. L., & Song, C. (2004). Building-mix optimization in district cooling system implementation. Applied Energy, 77(1), 1-13.
Chow, T., Fong, K., Chan, A., Yau, R., Au, W., & Cheng, V. (2004). Energy modelling of district cooling system for new urban development. Energy and Buildings, 36(11), 1153-1162.
Duke, M., Mee, S., & Diniz da Costa, J. (2007). Performance of porous inorganic membranes in non-osmotic desalination, Water Res. 41(17), 3998–4004.
Dysert, L. (2003). Sharpen your cost estimation skills. AACE Int. Tech. Board 45(6), 23- 45.
Gang, W., Wang, S., Xiao, F., & Gao, D. (2016). District cooling systems: Technology integration, system optimization, challenges and opportunities for applications. Renewable and Sustainable Energy Reviews, 53(2), 253-264.
Gökçek, M. & Gökçek, Ö.B. (2016). Technical and economic evaluation of freshwater production from a wind-powered small-scale seawater reverse osmosis system (WP-SWRO). Desalination, 381(2), 47–57.
Hart, D. R., & Rosen, M. A. (1996). Environmental and health benefits of district cooling using utility-based cogeneration in Ontario, Canada. Energy, 21(12), 1135-1146.
Hausmann, A., Sanciolo, P., Vasiljevic, T., Ponnampalam, E., Quispe-Chavez, N., & Duke, M. (2011). Direct contact membrane distillation of dairy process streams. Membranes, 1(1), 48–58.
Kavvadias, K., Khamis, L. (2010).The IAEA DEEP desalination economic model: A critical review. Desalination, 257(1–3), 150–157.
Kesieme, U. K., Milne, N., Aral, H., Cheng, C. Y., & Duke, M. (2013). Economic analysis of desalination technologies in the context of carbon pricing, and opportunities for membrane distillation. Desalination, 323(4), 66-74.
Khayet, M. & Matsuura, T. (2011). Chapter 15 – Economics, energy analysis and costs evaluation in MD. Membrane Distillation, Principles and Applications, 4(2), 429– 452.
Meindersma, G., Guijt, C., & de Haan, A. (2006). Desalination and water recycling by air gap membrane distillation. Desalination, 187(1–3), 291–301.
Minier-Matar, J. (2016). Field evaluation of membrane distillation followed by humidification/dehumidification crystallizer for inland desalination of saline groundwater. Desalination, 398(2), 12–21.
Rezaie, B., & Rosen, M. A. (2012). District heating and cooling: Review of technology and potential enhancements. Applied Energy, 93(4), 2-10.
Shanmuganathan, S. (2016). Sustainable processes for treatment of waste water reverse osmosis concentrate to achieve zero waste discharge: A detailed study in water reclamation plant. Procedia Environmental Sciences, 35(2), 930–937.
Shatat, M. & Riffat, S. (2012). Water desalination technologies utilizing conventional and renewable energy sources. Int. J. Low Carbon Technology. 18(1), 29–30.
Summers, E., Arafat, H., & Lienhard, V. (2010). Energy efficiency comparison of single- stage membrane distillation (MD) desalination cycles in different configurations. Desalination, 290(1), 2-5.
Warsinger, D. (2015). Scaling and fouling in membrane distillation for desalination applications: A review. Desalination, 356(1), 294–313.