Introduction
After identifying research objectives, hypotheses, and research questions, it is necessary to determine how the objectives are going to be achieved. This step involves identifying the do’s and don’ts of the research as well as statistical analyses to confirm or refute the established hypotheses. These aspects encompass the essentials of a research design. Therefore, a research design can be described as a procedural scheme, structure, or approach of investigation aimed at answering research questions (Neuman & Robson, 2014). The purpose of this paper is to provide a step-by-step guide to quasi-experimental and experimental designs, including the use of statistical analyses in both designs.
Basics of Research Design
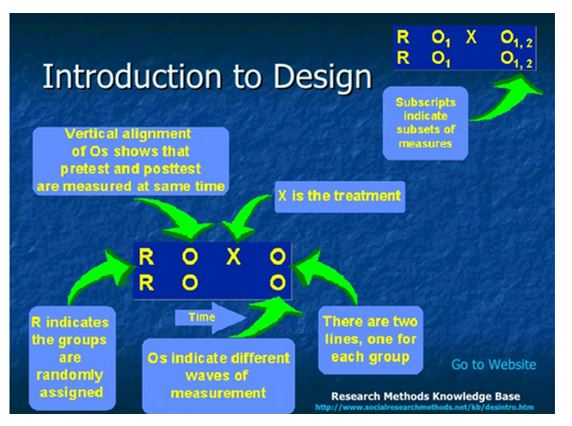
Research designs make use of three symbols to indicate the study design. The symbols include:
R = Random assignment of subjects into various groups.
X = Treatment or intervention.
O = Observation or measurement following the implementation of the intervention.
Quasi-Experimental Design
Quasi-experimental research designs evaluate test-effect relationships by determining the consequences of intermediation on a target population without randomization (Kim & Steiner, 2016). An independent factor that is engineered to influence a dependent variable is denoted as X. X may be a grouping variable with various levels. The term grouping refers to two or more groups, for example, two categories receiving different actions (for example, treatment and no treatment). The Y variable is the expected outcome following the implementation of an intervention. Assignment to groups is achieved by self-selection or administrator selection (Bärnighausen et al., 2017). In self-selection, subjects decide on the preferred intervention, whereas officials, policymakers, or researchers choose the intervention in administrator selection based on a specified criterion, for instance, a cutoff mark.
A quasi-experimental design is appropriate when randomizing subjects to intervention and control groups is impractical because of ethical, partisan, or logistical restraints (Rockers et al., 2017). Quasi-experimental methods are also appropriate for retrospective studies to investigate the outcome of an intervention long after the intervention has been effected. The major shortcoming of this approach is the risk of selection bias (Becker et al., 2017). Selection bias is the likelihood that individuals who agree to take part in the intermediation differ systematically from nonparticipants. Selection bias affects the results making it difficult to ascertain whether the observed differences between the two groups are due to the intervention or prejudiced selection. Therefore, there is a need to minimize selection bias by using a regression discontinuity design (RDD) or propensity score matching (PSM) (White & Sabarwal, 2014).
Examples of Quasi-Experimental Designs
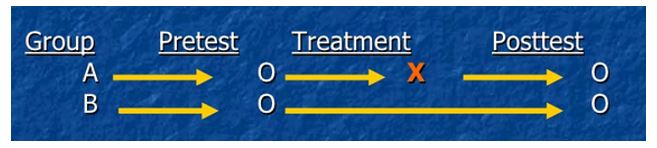
Nonequivalent groups pretest-posttest control group
This research design includes experimental and control groups and has demonstrated wide use in the education field because of difficulties in assigning subjects randomly to groups (Kim & Steiner, 2016). Therefore, already established groups of subjects are chosen. A pretest is done on both groups. The treatment is then administered to one group after which a posttest is given to both groups.
Pretest-posttest
This method does not entail comparisons with a control group. The outcome of interest is compared before and after exposure to the intervention. Significant differences in pre and post-treatment values indicate that the treatment is responsible for the change.
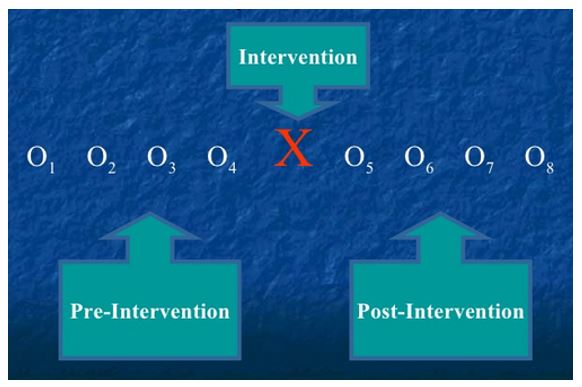
Interrupted time series design
A time series makes use of numerous observations over time to identify and eliminate threats to validity (Bernal, Cummins, & Gasparrini, 2017). An interrupted time series analyzes a single time series of data hypothesized to be influenced by external factors.
Comparative time series design
This designed is obtained by combining the interrupted time series design with the nonequivalent control group design.

Statistical Analyses
A quasi-experimental design is part of quantitative studies. Before deciding the appropriate statistical analysis, one should identify the scales of measurement involved in the independent and dependent variables. This step ensures that the data are organized in the best possible way. The second step involves using descriptive statistics to summarize the data. Commonly used descriptive statistics include:
- Frequency – the number of times a given value appears in the data set.
- Range – the highest and lowest values for any variable.
- Percentage – expresses values as percentages of the whole.
- Mean – a numerical average of values representing a specific variable.
- Mode – the most common value for a specific variable.
- Median – the arithmetic midpoint of values arranged in numerical order (Creswell & Creswell, 2017).
Descriptive data apply to the specific sample used in a study. However, the purpose of research is to use specific findings to solve similar problems in different settings. Therefore, specific research findings can be applied to the population through inferential statistics. Before conducting inferential statistics, it is necessary to formulate the null and alternate hypotheses.
An example of a null hypothesis would be that there is no difference between the means of a given outcome in the different treatment groups. This hypothesis would be written as H0: μ1 = μ2. The alternate hypothesis would be that there is a difference between the means of a given outcome in the different treatment groups, which would be written as HA: μ1 ≠ μ2.
T-test
The t-test is used to compare the means of two groups and factors the error involved in approximating the population mean from the sample mean. This statistic can be computed manually or using statistical software such as Microsoft Office Excel or Statistical Package for Social Sciences (SPSS). The testing procedure yields a p-value, which is used to make a statistical decision. If the p-value is less than 0.05, then there is sufficient evidence to refute the null hypothesis and conclude that the alternate hypothesis is true (Neuman & Robson, 2014). Three variations of the t-test exist:
- Two-sample t-test, which is also known as the student’s t-test or independent sample t-test and is used to compare the means of two independent samples.
- The paired t-test, which is used to compare related data, for example, pretest and posttest math test scores for students after implementing a specific revision method. The pretest and posttest scores used belong to the same students.
- One sample t-test, which is used when there is a need to compare a data set and a fixed value, for instance, English examination scores in a given school can be compared to a national average.
ANOVA
ANOVA facilitates the comparison of means involving more than two groups. For example, comparing the weight of babies fed on five different diets.
Regression
Regression determines whether one variable affects another variable. For example, whether consuming a specific diet leads to weight gain.
Multiple regression analysis
This test is appropriate when the impact of several variables on a given outcome is investigated.
Factor analysis
Factor analysis reduces the number of variables obtained from surveys into factors. It also examines the relationships between those variables.
Analysis of covariance (ANCOVA)
ANCOVA minimizes the preliminary differences between groups. It improves the strength of quasi-experimental findings by adjusting the data.
Experimental Design
Experimental research design is a quantitative study that determines cause-effect relationships between variables by manipulating the independent variable and observing the resultant dependent variable (Creswell & Creswell, 2017). The selection of subjects in experimental designs is usually randomized. Randomization implies that all subjects have equal chances of receiving a specified treatment, which counterbalances other factors that may influence the outcome. Therefore, it is possible to directly infer cause and effect relationships.
Examples of Experimental Designs
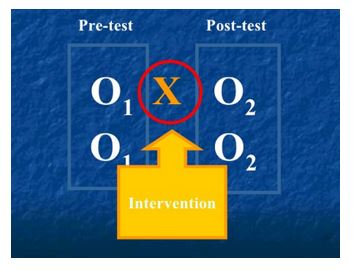
Pretest-posttest control group
This design checks the differences between groups before the intervention, which helps to ascertain the effect of the manipulation (intervention). The main advantage of this approach is that it controls for eight threats to internal validity if done diligently (Creswell & Creswell, 2017). However, the main shortcoming of this design is that pretests may manipulate the effect.
Solomon four-group design
This design is an expansion of the pretest-posttest control group design. It is considered the most robust experimental approach because it minimizes the biases associated with pretesting.
Posttest only control group
This research design is a modification of the last two groups in the Solomon four-group design.
Statistical Analyses
The methods of statistical analysis used in experimental design depend on the type of design. For example, data obtained through the pretest-posttest control group design are analyzed by conducting an analysis of covariance on posttest counts using the pretest as the covariate (Kazdin, 2016). Data analysis for Solomon’s four-group design experiments involves ANOVA on posttest scores (Creswell & Creswell, 2017). On the other hand, the easiest and best-suited test for significance in the posttest-only control group design is the t-test (Creswell & Creswell, 2017).
Conclusion
A researcher should have a good understanding of the research problem and objectives. This knowledge helps to determine the most appropriate research method. As a result, it is possible to conduct the appropriate statistical analyses to answer the research questions.
References
Bärnighausen, T., Tugwell, P., Røttingen, J. A., Shemilt, I., Rockers, P., Geldsetzer, P.,… Bor, J. (2017). Quasi-experimental study designs series—paper 4: Uses and value. Journal of Clinical Epidemiology, 89, 21-29.
Becker, B. J., Aloe, A. M., Duvendack, M., Stanley, T. D., Valentine, J. C., Fretheim, A., & Tugwell, P. (2017). Quasi-experimental study designs series—paper 10: Synthesizing evidence for effects collected from quasi-experimental studies presents surmountable challenges. Journal of Clinical Epidemiology, 89, 84-91.
Bernal, J. L., Cummins, S., & Gasparrini, A. (2017). Interrupted time series regression for the evaluation of public health interventions: A tutorial. International Journal of Epidemiology, 46(1), 348-355.
Creswell, J. W., & Creswell, J. D. (2017). Research design: Qualitative, quantitative, and mixed methods approaches (4th ed.). Thousand Oaks, CA: Sage Publications.
Kazdin, A. E. (2016). Single-case experimental research designs. In A. E. Kazdin (Ed.), Methodological issues and strategies in clinical research (pp. 459-483). Washington, DC: American Psychological Association.
Kim, Y., & Steiner, P. (2016). Quasi-experimental designs for causal inference. Educational Psychologist, 51(3-4), 395-405.
Neuman, W. L., & Robson, K. (2014). Basics of social research (3rd ed.). Toronto, Canada: Pearson.
Rockers, P. C., Tugwell, P., Grimshaw, J., Oliver, S., Atun, R., Røttingen, J. A.,… Bärnighausen, T. (2017). Quasi-experimental study designs series–paper 12: Strengthening global capacity for evidence synthesis of quasi-experimental health systems research. Journal of Clinical Epidemiology, 89, 98-105.
White, H., & Sabarwal, S. (2014). Quasi-experimental design and methods. Web.