Introduction
This study investigates the relationship between Grade Point Average (GPA) and IQ scores among ninth graders. A random sample of 40 ninth graders aged 14 years old was selected. An educator administered Wechsler Intelligence Scale for Children-Fourth Edition (WISC-IV). WISC-IV includes a Full Scale IQ comprising of verbal comprehension, perceptual reasoning, working memory, and processing speed skills. However, it is called as IQ in this study. The data collected was analyzed using SPSS.
Hypothesis
The null hypothesis claimed that there is no relationship between IQ and GPA. This means that increase in IQ level does not affect students’ GPA. From theory, it is expected that IQ affects students’ GPA scores.
Variable and their attributes
The variables in this analysis were IQ and GPA. The IQ was the independent variable and GPA was the dependent variable. According to the regression model investigated, increase in IQ was expected to cause some changes in GPA. Both variables were expressed in quantitative form and were in ratio scale.
Descriptive Statistics
Mostly, the descriptive statistics entails the measures of central tendency and measures of dispersion. Measures of dispersion include variance, standard, deviation, quartiles, percentiles, and range among others. According to Trochim (2006), the measures of central tendency are mean, median, and mode and they play a major role in determining the shape of a distribution. Measures of dispersion describe how far the elements of a data set lie from the mean.
IQ
The mean was 85.1 and the median 82.0. The mean is a single figure representing the average of a dataset. The median is the figure at the middle of a dataset when arranged in increasing or decreasing order. For a normal distribution, the mean, mode, and median are the same and if not, the distribution is either skewed to the right or to the left. The mode for IQ series was 66.0. Mean, mode, and median were different meaning that the distribution was not normal. The standard deviation was relatively small (16.4) meaning that most of the values were around the mean (Sinn, n. d). Skewness was 0.374 which was greater than zero. This meant that the distribution was skewed to the right.
GPA
The mean of GPA was 2.73 and median 2.85. This meant that they were not equal and, therefore, the distribution of GPA series was not normal. The mode (2.90) was also not equal to median and mean. The standard deviation was 0.64815. This meant that on average, the elements of GPA series were 0.64815 standard deviations away from the mean. The standard deviation was small meaning that most of the figures were close to the mean. The coefficient of skewness was 0.374. If skewness is positive, the distribution is skewed to the right.
WISC-IV with a mean of 100 and standard deviation of 15
The assumption that could be made about IQ scores in this case was that they were too close to the mean. They were 15 standard deviations from the mean. This made the test for IQ test for the sample more suitable. When the figures are close to one another, it is more effective to obtain accurate marginal effect of a variable to another.
How many student IQ scores are in this sample are within one standard deviation below test mean?
In this case, the sample size that gives a mean of 100 and a standard deviation of 15 was obtained. The mean of 100 at a confidence level of 95% lied within 1 IQ points from the mean. The number of students found within one standard deviation from the test mean was calculated as follows:
This was a two-tailed test and each of probability of 0.025. The critical value of Z score at 95% was 1.96.
n = [z*s/E] ^2 = [1.96*15/1] ^2 = 864 students. For two standard deviations from the mean, n = [z *s/E] ^2 = [1.96*15/2] ^2 = 216 Students.
Percentage with IQ scores less than or equal to 70
P (x≤ 70) = 0.5 – (70/216) = 0.1759 = 17.59%
Percentage with IQ scores greater than or equal to 100
P (x≥100) = 1 – (100/216) = 0.5370 = 53.7%
Correlation
Pearson correlation coefficient was used in this study. The coefficient of correlation between IQ and GPA was 0.608. The p-value of correlation coefficient was 0.000. This was greater than the level of significance of 0.01. According to Sinn (n. d.), the conclusion was made that Pearson correlation coefficient was insignificant at α = 0.01. When correlation is significant, it means that a change in one variable has an important effect on the other. Conclusion about correlation can also be made using the scatter plot below:
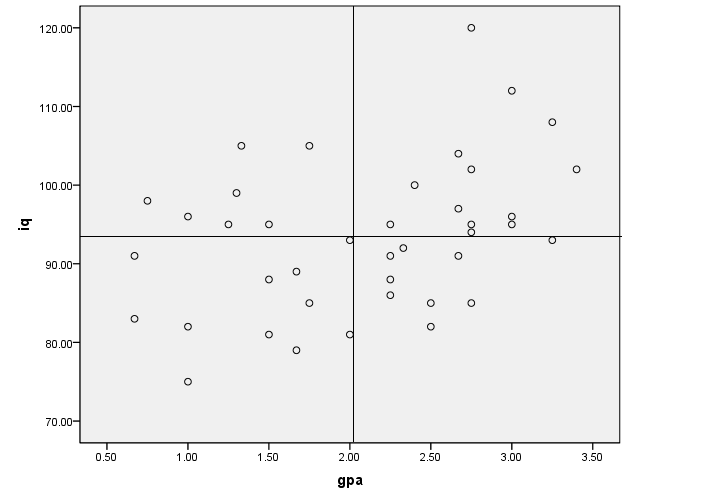
The plotted figures in the scatterplot seem to be moving towards the right-hand side. This means that the two variables are positively correlated (Unknown, n. d). Increase in IQ caused an increase in GPA. The correlation coefficient was also positive. This confirmed that increase in IQ has a positive impact on GPA. The strength of the relationship between the two variables could be described as moderate. A coefficient of 0.608 is neither too close to 1 nor 0. Strong correlation arises when the coefficient is close to 1. When the coefficient is too close to zero, correlation is said to be weak. The results reject the null hypothesis because they show that correlation exist between IQ and GPA. The null hypothesis was rejected at 1% level of significance meaning that there was a moderate correlation between IQ and GPA (Trochim, 2006).
The results on correlation, however, do not tell the extent to which IQ affects GPA. It only tells the direction of the effect. Regression analysis was used to show the marginal effect of IQ on GPA.
The sample size and method of data collection may affect the results obtained. The sample size should be sufficient to represent the population. The method used to collect data should also not be biased. If these two factors are considered, then the results will be credible.
Regression analysis
The regression model estimated could be stated as follows:
- GPA = β0 + β1IQ + ε………………………………………………………………..………… (i).
GPA was the dependent variable and IQ the independent variable. The parameter β0 was the intercept of the regression line. The coefficient of IQ in the model was β1 and it measured the effect of IQ on GPA. The term ε was the error term or stochastic term. The results obtained from SPSS estimated equation (i) as follows:
- GPA = 0.685 + 0.024 IQ…….…………………..………………………………..………… (ii).
The t-statistic value was 4.721 and had a p-value of 0.000. The coefficient of determination was 0.608 or 60.8%. The null hypothesis (H0: βi = 0) claimed that IQ was not an important determinant of GPA. The t-statistic had a p-value of 0.000 which was less than the level of significance of 0.01. The null hypothesis was, therefore, rejected at 1% level of significance (VCU, 2010). The conclusion was that IQ is an important determinant of GPA. The coefficient of determination (R-squared) showed that IQ explains 60.8% of variation in GPA. The rest of variation (39.2%) was explained by other factors not included in the model. The coefficient of IQ was positive meaning that an increase in IQ by one unit increased GPA by 0.024. The intercept of the regression line (0.685) showed the value of GPA at zero IQ. It summed up the effect of all other factors left out of the model.
The ANOVA test output given was used to test overall significance of the variables included in the model. The F-statistic was 22.286 and had a p-value of 0.000. The test was conducted at 1% level of confidence. The null hypothesis was that all variables were jointly insignificant. Since the p-value was less than the level of significance, the null hypothesis was rejected (UCLA, n. d). The variables were, therefore, jointly significant.
Conclusion
IQ was proven to be an important determinant of GPA. The null hypothesis was rejected at 1% level of significance. The two variables GPA and IQ were found to be moderately correlated. Increase in IQ increased GPA according to the results obtained. To increase students’ GPA, institutions should look for ways of increasing their GPA.
Reference
Sinn, J. (n. d.). SPSS guide: Correlation and regression. Web.
Trochim, W. M. K. (2006). Research methods: Knowledge base. Web.
UCLA. (n. d.). Annotated SPSS output: Correlation. Web.
Unknown. (n. d.). Correlation, scatterplots, and regression: Generating results in SPSS, reading SPSS output. Web.
VCU. (2010). SPSS help sheets: Simple linear regression. Web.