Research Paradigm
Research methods are greatly influenced by the paradigms used in the research. “Two scholars who hold different beliefs[paradigms]…may be interested in examining the same phenomenon but their beliefs will lead them to set up their studies very differently because of their differing views of the evidence, analysis and the purpose of the research”(Potter 1996 as cited in Wimmer & Dominick, 2013, p.118). A research paradigm consists of the beliefs and postulations about the discernment of the world that help a researcher with a structure to carry out his research. Despite the concealed nature of the philosophical experiences in most research, their influence cannot be denied in the practice of research (Wahyuni, 2012).
Different paradigms see the nature of reality (ontology) in diverse ways and adopt distinctive techniques to seek information about that reality (epistemology). There is no objective basis for choosing a paradigm. It depends on the researcher’s presumptions about the existence of reality (Hine& Carson, 2007). Prominent writers like Berry and Otley (2004); Creswell (2009); and Neuman (2011) believe that the selection of a research paradigm is a significant step and needs to be clarified at the beginning of the research. It influences every aspect of a research process including the way of framing and perceiving a social phenomenon (Wahyuni, 2012).
Paradigms or models are a significant element of research as they provide a base for the selection of an appropriate research methodology. According to Neuman (1997) and Blaikie (1993), “There are three distinct approaches to social science research: positive (or objectivist), interpretive, and critical” (as cited in Wimmer & Dominick, 2013, p.117). These three paradigms are a universally accepted array of theories, techniques, and assumptions representing researchers’ perceptions of the world.
Positivist paradigm
This is the oldest and extensively used model in the field of mass media and social science research. Positivism is based on the philosophies of Comte and Mill. However, with the development of social sciences, researchers have modified this technique as per their purpose and convenience. The Positivist paradigm is based on the concepts of quantification and hypothesis. It also involves the concept of objective measures. According to the positivist, approach reality is not influenced by the views and prejudices of the researcher and is seen by all in the same manner, in objectivity. This technique emphasizes that studying different parts of the whole (individual behaviour or social situation) can help in acquiring complete knowledge of the whole. Positivists study the feelings and behaviours of all human beings in a general and comprehensive manner. This approach creates common laws of behaviour and offers a universal explanation for various things and situations. Research is conducted within a pre-determined research design in controlled settings. Moreover, in the positivist research paradigm, research data can be collected without active participation and is used to test or support some existing theory.
Interpretive paradigm
During the 1970s and 1980s, a new model known as the interpretive paradigm, which was based on the theories of Max Weber and Wilhelm Dil, became prevalent in mass media research. The interpretive model of research aims to understand people’s perceptions about their natural surroundings. Researchers using an interpretive model focus on the way people create meaning to different things and events they come across every day and how they elucidate these events. The interpretive paradigm allows every researcher to observe reality differently. In the research process, a researcher can create his reality. Hence, the reality is subjective in the interpretive technique of research that subsists only on the observer. The approach sees reality as a whole that cannot be understood in subdivisions. It sees distinctiveness in individuals and social phenomenon that requires specific observation and in depth knowledge leading to different and unique explanations about different individuals and different settings. In the interpretive research paradigm, the researcher works as an active participant in collecting data and does not stick to a pre designed research design. The research design evolves during the research process and can be altered as per the requirement of the study. Interpretive studies are conducted in natural settings without supervising unnecessary variables. The researcher is the data collection instrument in the interpretive research paradigm. The interpretive paradigm aims at developing theories based on the collected data (Wimmer & Dominick, 2013, pg.117).
Critical paradigm
Critical educational research is a newly emerging concept in the field of educational research. It emerged in response to the neglect of political and ideological context in the study of social behaviour in positivistic and interpretive paradigms. The critical theory attempts to see the legitimacy of interests in specific settings concerning their provision of egalitarianism and democracy. The critical paradigm of research is based on the belief that research is carried out for “the emancipation of individuals and groups in an egalitarian society” (Cohen et al, 2007, p.26).
The critical theory paradigm is greatly swayed by the works of Habermas and his predecessors in the Frankfurt School. It is visibly a prescriptive and normative model of research. “Its intention is not merely to give an account of society and behaviour but to realize a society that is based on equality and democracy for all its members” (Cohen et al, 2007, p.26). It studies social situations and phenomena not only to understand them but to transform the existing powerlessness and inequality in the society into individual liberties within a democratic setting (Cohen et al, 2007). It studies concepts that are related to power distribution in society and political ideology (Wimmer & Dominick, 2013).
The Positivist paradigm was suitable for the present study as it sees real events empirically and tries to find logical analysis of the observations. Using a positivist approach, we could evaluate the validity of the existing information regarding the significant issues that influence citizens’ satisfaction to use e-government in Jordon. This approach was useful in producing universal generalizations that can be applied and tested across contexts. Using a positivist paradigm in the present study will limit the probability of contamination of data and will reach a bias free conclusion.
Research Methods
This part of the research deals with the research methodology that was employed in conducting the study. It, therefore, covers the research locale, research design, target population, sample selection, research instruments, conducting, reliability of research instruments, the validity of the research instruments, data collection procedures, data analysis, and reporting.
According to Dawson (2009), it is must to know the difference between qualitative and quantitative methods before research methodology starts (Research Methodology: An Introduction, n.d.). Qualitative research is done to improve quality and is often considered as ‘Motivational Research’. It also focuses on people’s opinions about particular subjects or institutions (Research Methodology: An Introduction, n.d.).
Qualitative research involves subjective data. Dawson (2009) mentions that qualitative research focuses on behaviour, attitudes, and experiences through the methods like interviews. Since attitudes, behaviour and experiences are very important so this kind of research tries to get in depth feelings and opinions from the people who participate in the survey (Research Methodology: An Introduction, n.d.).
Quantitative research is a pragmatic approach used for research purposes. The quantified data is captured here. It involves objective data. Dawson (2009) states that quantitative research aims to target more people and connecting with people is much quicker than it happens in qualitative research. Both the researches need skilful, trained and experienced researchers.
The research methodology that was used in the study is the quantitative approach. By using this methodology, the hypotheses of the research questions can be measured, determined, and analyzed. The method also helped in determining the quantity and consistency of results. The method used is a descriptive representation of the phenomenon and collect quantifiable data that can be statistically verified and analyzed to measure the effectiveness of the whole research. It also intends to know about the understanding of people relating to a particular subject or institution (Research Methodology: An Introduction, n.d.).
Quantitative research methodology is used because data (perceived effectiveness) being tested in this study was through various sources which support it. The study is guided by the actual data collected from the respondents, and the purpose of the study is to analyze them. Such a worldview requires the analysis of the strength of the facts and comments.
This worldview entails a systematic procedure and structure in the research process because it follows a rule-bound approach, which meant that this worldview made use of surveys, content analyses, field experiments, and other assessments that will collect verifiable data (Philimore& Goodson, 2004). The worldview also entails the focus on data that will reveal trends, patterns, and statistical relationships. A quantitative research methodology will also be used because the method will utilize open-ended questions as well as close questions; pre-determined approaches, and numeric data (Creswell, 2003).
According to Ross (1999), the quantitative method is more frequently associated with using surveys, which entails studying a large number of subjects that is drawn from a specific population. The research design for this study will employ the use of survey questionnaires and analyzing data gathered from the respondents.
Research Types
According to Robson (2011), “Research is the process we take to develop theories. Despite a common portrayal of theory as abstract ideas that have little to do with reality or practice, theory and practice are integrally connected. The theory is the explanation of how things are, and practice is the application of that knowledge to solve real-world problems” (Nishishiba et al, 2013, p.34).
Ideally, there are two key epistemological approaches in all research; induction (exploration) or deduction (confirmation). Inductive or exploratory research implicates the search for “pattern from observation and the development of explanations- theories-for those patterns through a series of hypotheses” (Bernard, 2011, p.7).
The researcher continues to test the hypotheses against new settings until he reaches a saturation point that does not demand further testing. Whereas deductive research starts with pre-existing theories as to the basis of hypotheses and then moves on to the observations either to approve or falsify the hypotheses (Bernard,2011).In confirmatory research, the researcher tests hypotheses that help him in finding a definite path of action. On the other hand, exploratory research leads to generating hypotheses in the first place. Hence, exploratory research is mainly inductive, while confirmatory research is normally deductive.
Exploratory research: Exploratory research is conducted through experiments or observations. Its key objective is to acquire new knowledge that can generate new hypotheses (Jaeger & Halliday, 1998).
The accumulated observations help the researcher to recognize the patterns. The prevalence of patterns in the observations develops a hypothesis which becomes a theory if repeatedly confirmed through more observations (Nishishiba et al, 2013). Exploratory research focuses on generating innovative ideas. The researcher develops multiple new ideas and then selects a smaller number of alternatives producing new ideas. Exploratory research produces qualitative data that is textual, visual and oral. As the qualitative research is not aimed at numbers but expressive descriptions like stories, explanations and other meaningful portrayals, exploratory designs normally do not generate quantitative data that is expressed in numbers in an organized and expressive manner (Zikmun & Babin, 2006).
Confirmatory research
In a confirmatory or deductive approach, the pattern of ideas about specific things forms the hypothesis and its accuracy is tested in different instances. The hypothesis becomes a theory that is confirmed through the researcher’s observations (Nishishiba et al, 2013). The confirmatory research process initiates with presupposed hypotheses that lead to the development of a research design for testing the hypotheses, data collection and data analysis and at the end inferring conclusions (Jaeger & Halliday, 1998, S64). According to Loseke (2013) “A deductive approach starts with a general idea or set of principles that suggest more specific ideas on how things are” ( as cited in Nishishiba et al, 2013, p.34). Therefore, a researcher requires adopting a confirmatory or deductive approach while testing or confirming a hypothesis.
The confirmatory approach is suitable for the present research since it aims at confirming the already existing information about the factors influencing the use of e-government by the citizens in Jordon.
Questionnaire Pre-Test
The questionnaire is a significant component of a research process that helps in achieving high quality in a survey. Pre-testing is an important and assured way of ensuring the appropriateness of the questionnaire. Pre-testing a survey questionnaire aims at assuring the proper communication of the intended idea to the respondents. It also checks that the questions are simple and make sense to the respondents. Pre-testing also helps in providing valuable insights for improving the quality of the questionnaire.
Pre-testing involves a small number of respondents who share similar characteristics relative to age, education etc. with the intended subject. The responses attained through pre-testing confirm the comprehensiveness of the questions. The respondents must understand and be willing to answer the questions (Alasuutari, 2008).
For the successful completion of research work, all research instruments must be tested carefully to determine their appropriateness in real settings. Questionnaires are pretested in survey research to identify research problems and remove uncertainties. Pre-testing helps in recognizing respondents’ difficulties in completing the survey concerning the language or the structure of the questionnaire. Two approaches can be used for pre-testing:
1) Pre-field techniques: Pre-field techniques are usually applied at the beginning while developing the research instrument. It is applied to the respondent focus group through interviews.
2) Field techniques: In this technique questionnaires are tested under field settings and include activities like behaviour coding, probing and analysis of unanswered items and response dispersions (Gideon, 2012).
In the present research, the survey questionnaire was pre-tested on ten respondents who were online shopping experts from three different departments and PhD students from information system and business departments. Pre-testing of the questionnaire revealed some weak points questionnaire concerning the construct of the questions and typographical errors. These faults were rectified before initiating the actual survey.
Ethic for the survey Analysis
Qualitative research has a different ethical problem in comparison to quantitative research. The ethical conflict occurs in connection to how a researcher approaches a community group and what kind of effect he may have on the participants. The main focal point of qualitative research is to define, explore and examine people their likely atmosphere. There are some ethical principles in scientific research which are described as follow:
Voluntary participation and harmlessness: Participation in any survey by the subjects is voluntary. They can leave the survey at any moment, and they will not face any critical outcome. Their participation and non-participation in any research are harmless. Though the participation is voluntary, yet it is a must that all participants sign an Informed Consent to indicate their intention for not participating in the survey and their right to withdraw but it is done before their response in any study is traced (Bhattacherjee, 2012).
Anonymity and confidentiality: In such kinds of studies, the identity of the subjects is not revealed. It is to save their interests and future safety. Anonymity means that the researcher is not able to know the identity of the respondent. In a mail survey, maintaining anonymity is possible but in a face-to-face survey, it is not possible. Confidentiality is guaranteed to the subjects where the researcher is aware of the identity of the respondent but promises not to reveal it.
Analyzing and reporting
Negative findings should be disclosed in any research and interesting elements should be added while analyzing any report. After getting facts based on data analysis, a hypothesis should be created (Bhattacherjee, 2012).
For this study ethics, approval was acquired from the University Human Research Ethics Committee to collect data to achieve the objective of this study. Respondents were made aware of the purpose of the study, the researchers agreed not to reveal the identities of the participants and not to disclose their personal information for ethical reasons. All the respondents were made sure that their views on any questions would be kept confidential. This was to win their trust so the quality of data could be good. A particular time frame of the survey was decided, and it was determined that interview time would not exceed the set time and the respondents would not be stressed except they wanted time for answering questions.
Sample and Sampling Methods
“Sampling is the statistical process of selecting a subset (called a “sample”) of a population of interest for purposes of making observations and statistical inferences about that population” (Bhattacherjee, 2012, p.65).
It is always difficult to study whole populations since practicability and cost constraints are involved in it. Therefore, a representative sample from the population of interest can be taken that can be observed and analyzed. A sample that genuinely represents the population is of major significance because the conclusions that came from the sample can be taken as a broad view of the population of interest.
The sampling process has many stages. The first stage is related to targeting the population. A population is that unit of analysis that a researcher wants to study. Any group, person, country or organization as a unit of analysis can be targeted for representing scientific results. Sometimes it is clear which population should be targeted and sometimes it is difficult to understand. For example, if a researcher wants to know about the chief drivers of educational learning among school students then what should be the target population- students’ parents, students, the principal of the school or the teachers? It should be the students since a researcher would be interested in knowing the performance of the students, not the teachers, principal, or the students’ parents.
The second stage is to choose a sampling frame that has an easy to get a section for the population that can be targeted from where a researcher can draw a sample. Suppose a researcher wants to target the population of employees for his research, he can use the list of employees from a couple of companies who are interested in participating in the survey. This is a more realistic sampling frame since it is not easy to access all professional employees around the world.
The last step is to use a sampling technique. It has two types- probability and non-probability. “Probability sampling is a technique in which every unit in the population has a chance (non-zero probability) of being selected in the sample, and this chance can be accurately determined” (Bhattacherjee, 2012, p.67).
Probability sampling has diverse types as follows:
- Simple random sampling: In this technique, there is a strong possibility of equal selection of the population participating in the study without having any biased estimations.
- Systematic sampling: The sampling frame is arranged in this technique based on some criteria and the elements are chosen as per that arranged list.
- Stratified sampling: In this sampling, the sampling frame has two divisions- homogeneous and non-overlapping subgroups.
- Cluster sampling: The population is divided into clusters on the basis of geographical boundaries.
- Matched-pairs sampling: In this sampling researcher compares two subgroups within one population based on one particular decisive factor.
- Multi-stage sampling: All the above-mentioned sampling techniques are single-stage sampling techniques. These techniques can be joined to carry out the multi-stage sampling. Like, a researcher can use stratified sampling along with systematic sampling for studying businesses based on firm size.
- Non-Probability sampling: “non-probability sampling is a sampling technique in which some units of the population have zero chance of selection or where the probability of selection cannot be accurately determined” (Bhattacherjee, 2012, p.69).
Following are the several types of non-probability sampling:
- Convenience sampling: It is known as an opportunity and accidental sampling also in which sample is pulled out from voluntarily accessible population. For example, if a researcher is conducting a survey in a shopping centre and gives questionnaires to walk-in people, the sample he gets from that survey is considered as a convenience sample. It is a non-probability sample since it rules out the people who do shopping in other shopping centres.
- Quota sampling: The population is segregated into equally elite subgroups and to meet a predefined quota the systematic observation of these subgroups is done.
- Expert sampling: In this technique, respondents are selected based on their skills related to the event, which is premeditated.
- Snowball sampling: In this technique, a researcher recognizes the population which is fit as per the criteria of his study and ask for the recommendation of others who can be associated with the study.
The population which is being targeted for this study is the use of any e-government website in Jordon. This study is conducted in three major ministries in Jordon (Health Ministry, Education Ministry and Labor Ministry)
A large no of participants is used in the sample. Since this is a descriptive design, sampling is a significant process because of the need to obtain an accurate representation of the population (Heck, 2004).
Sample Size
Sampling is the basis of any research. When deciding about sample size it is necessary to know first who to interview and how many people are needed for the interview. The larger a sample is, the confidence is greater which helps in concluding the population (Sample Size Methodology, 2015). Since there will be a great number of users of any e-government website, the sample size should be based on that. So, when choosing sample size for this study, three criteria should be taken care of:
- The level of precision which is also called sampling error
- The Confidence levels
- Degree of variability- it depends on the target population. “The more heterogeneous a population is, the larger the sample size is required to get an optimum level of precision” (Sample Size, 2015, para 4).
When deciding about confidence level, it should be considered how wide or narrow should our confidence interval be.
“A confidence interval for a population parameter is an interval with an associated probability p that is generated from a random sample of an underlying population such that if the sampling was repeated numerous times and the confidence interval recalculated from each sample according to the same method, a proportion p of the confidence intervals would contain the population parameter in question” (E-government Benchmark Framework, 2012, p. 19).
Data Collection Techniques
Once the research design is chalked out, the researcher needs to look out for appropriate data collection techniques. There are two types of data: primary data and secondary data. Primary data is collected by the researcher through various techniques, hence, is original. Secondary data refers to the already existing information about the subject in the form of books articles, research works etc. The methods of collecting primary data differ from that of secondary data. Secondary data is only the compilation of related information whereas primary data collection can be done using different methods (Kothari, 2004, p.95).
Survey: Survey is a common tool of primary data collection. In survey research, data is collected through either interviewing the respondents in the actual settings, sending questionnaires to the respondents through emails or distributing questionnaires to the respondents in a class or office etc. According to Pinsonneault and Kreamer (1993) “survey is a means for gathering information about characteristics, actions, or opinions of a large group of people” (as cited in Glasow, 2005, p.1-1).
Surveys can also be used to consider needs, assess demand, and observe the impact. Surveys can also be used to consider needs, assess demand, and observe the impact. Survey research has mainly three distinctive features: First, it is used to provide a quantitative description of specific aspects of a particular population that assess the relationship among variables. Second, surveys yield subjective data as it is gathered from people. Besides this, surveys are an efficient tool for collecting data from a selected percentage of the population that can be generalized back to the population. “In survey research, independent and dependent variables are used to define the scope of the study, but cannot be controlled by the researcher” (Salant & Dillman, 1994 as cited in Glasow, 2005, Pg.1-1).
Interviews: The interview method includes the “presentation of oral verbal stimuli and replies in terms of oral verbal responses” (Kothari, 2004, p.97). Interviews are carried out personally or through telephones. Personal interviews require face-to face contact with the person to be interviewed and are in the form of direct or indirect oral investigation. Personal interviews are conducted systematically. Unstructured interviews have a flexible approach to questioning. The researcher has the freedom to change, add or omit questions as per the requirement of the situation. However, unstructured interviews demand greater efficiency from the researcher. For collecting data through the interview method, the interviewer needs to possess certain qualities such as friendliness, courtesy, honesty and neutrality. He should keep the direction of the interview on track (Kothari, 2004).
Secondary data: Secondary data is collected through the scrutiny of various published and unpublished materials. Published data may include government publications, technical and business journals, research works of scholars, universities etc., books, magazines and newspapers and statistical and historical records etc. Unpublished sources include letters, unpublished biographies and public or private personal or professional organizations. However, the researcher should ensure that the secondary data sources are reliable, suitable and adequate for his research (Kothari, 2004, p.111).
Advantages of survey method:
- The probability of the accuracy of the survey results has increased with the use of advanced technology in survey techniques. “Techniques like probability sampling and standardized measurement, allow researchers to feel confident that the population sample is not biased and that comparable information is being obtained about everyone in the selected population” (Cargan, 2007,p.90).
- A descriptive assertion about a large population can be built with the help of the responses obtained from the probability sample.
- The survey method has the flexibility of asking many questions on a certain topic.
- In the survey, we can include a large number of variables that help in obtaining accurate results and also avoiding any potential inaccuracy.
- The survey method allows the analysis and reanalysis of the collected data with different variables. However, there is generally a different researcher, with a different purpose, to reanalyze the collected data. In this way, the secondary analysis consumes less time and is less expensive (Cargan, 2007).
- Surveys are suitable for collecting demographic data that describe the composition of the sample. It can efficiently produce information about the attitudes that are not measured by observational methods (McIntyre, 1999 as cited in Glasow, 2005, p.1-1).
Types of surveys:
Surveys are either cross-sectional or longitudinal.
Cross-sectional surveys: Cross-sectional surveys are conducted to study a cross section of the population at a single point in time. Cross-section refers to a “broad sampling of persons of different ages, different educational and income levels, different races, different religions and so on” (Bailey, 2008, p. 36).
The essence of the cross-sectional studies is the census that makes it necessary for the researcher to interview all the respondents during the same period. A cross-sectional study is advantageous in the way that data can be gathered from a large number of people during the same period. These data can easily be compared since they are not affected by deviations over time.
Longitudinal survey: In a longitudinal survey involves data collection over a long period. It involves fewer respondents to limit the effort and expenses of encompassing different points in time. It is useful in studying the changes that take place in course of time. For example, attitudinal changes can be studied in a better way through longitudinal surveys (Bailey, 2008, p.36).
For this research, the cross-sectional online survey approach was used as the study was aimed at collecting information about the citizens’ perception and their satisfaction with the e-government in Jordan. The paper also studied the critical factors influencing citizens’ satisfaction in using e-government in the country. A cross-sectional online survey was conducted as the subject required gathering information from a large number of people at some point in time. It was necessary for comparing the data effectively and avoiding any deviation over time.
To conduct the survey effectively online link including the survey was sent to the three ministries to put on their websites. Besides this, the researcher also visited those three ministries to collect data using a paper survey.
Data Analysis Techniques
This study will use the Structural Equation Modeling (SEM) Technique. Structural equation modelling is a resourceful numerical modelling device. Its analyzing techniques, broadness of functions and modelling competencies are increasing fast. It has become very popular in the last two decades because of its litheness and simplification (Lei & Wu, 2007). They are extensively used in the social and behavioural sciences and biostatistics. Structural equation modelling can handle measurement errors, latent variables and multiple indicators in systems of equations. It has made this technique popular.
“Despite the vast number of SEM users, the discussions of taking account of weighting and complex samples have been limited. This is surprising in that many SEMs are applied to survey data with multistage sampling and unequal selection probabilities of individuals” (Bollen et al, n.d.).
Structural equation modelling is:
- A concept for identifying SEMs
- A system for thinking about SEMs
- A technique for evaluating the factors of SEMs
Structural equation modelling consists of the evaluation of two models: a measurement model and a path model.
Path Model: This model estimates many different regression models which are evaluated at the same time.
In structural equation modelling, a path diagram is used to exemplify the models. The following diagram describes (STATA structural equation modelling, 2013).
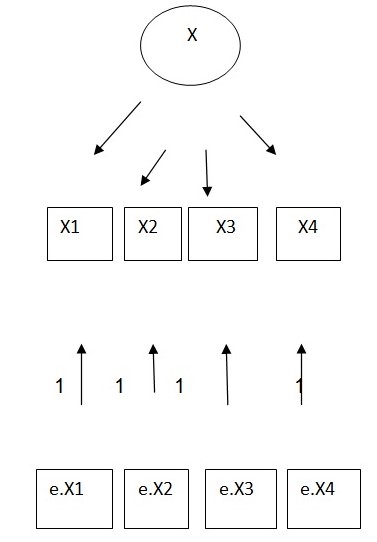
The variables are written in boxes and circles:
- The variables written in the boxes are studied in the data.
- The variables written in the circles are not studied and they are called dormant variables.
Arrows join circles and boxes that is why they are considered paths:
- If a variable is indicated from one to another through a path, it shows that there is an impact of the first variable on the other variable.
- If the number is written with the arrow, then the resultant coefficient is evaluated through data. At times symbols are also used with the path to put weight on it but from time to time it is not done that way.
- The path diagram which is employed to illustrate the model can be applied to present the outcomes of the evaluation. It follows that evaluated coefficients are depicted with the paths.
Measurement Model: Psychometric theories generated the measurement of dormant variables. The dormant variables, which cannot be evaluated directly, are presented by responses to those many variables that can be observed.
“Latent constructs such as intelligence or reading ability is often gauged by responses to a battery of items that are designed to tap those constructs. Responses of a study participant to those items are supposed to reflect where the participant stands on the latent variable” (Lei & Wu, 2007, p.34).
Confirmatory factor analysis is a means by which the measurement model in structural evaluation modelling is analyzed.
The first level-weights are scaled in multi-level structural equation modelling. There are many methods for scaling, like, scaling to an effective or with-in cluster sample size.
“Asparouhov (2006) suggested an extension of Grilli & Pratesi’s (2004) estimation method and performed a Monte Carlo evaluation of six candidate methods of scaling within-cluster weights; he suggested to scale weights to the within-cluster sample size” (Bollen et al, n.d., para 10).
When the model is accurate, model-based assessment seems to be better than design-based assessment. The benefit of design-based evaluation is that it does not depend on the correctness of any model and its disadvantage is that its efficiency can be lost.
Further, we will come to know how structural equation modelling works. There are various steps through which every SEM analysis goes like, model specification, model estimation, model evaluation, data collection and model modification. Following are the details of each step:
Model Specification: A strong model is based on theory and the basis of a theory depends on knowledge in the field, findings in the literature, person’s educated presumptions, which specify causes and effects of theoretical variables. Since the model specification has flexibility, several models can be imagined. But is also true that all specified models cannot be analyzed and evaluated. After recognizing a model, every model parameter can be evaluated exceptionally.
Data Characteristics: “Like conventional statistical techniques, score reliability and validity should be considered in selecting measurement instruments for the constructs of interest and sample size needs to be determined preferably based on power considerations” (Lei & Wu, 2007, p.35).
A larger model needs a larger sample then it can give steady parameter evaluation. Data collection should be done after specifying the mode of interest so on that basis sample size can be established on a priority basis.
Structural equation modelling is a huge sample method. If a sample size is large for an estimated evaluation, then, statistical results and model evaluation or investigating hypothesis about any precise model and individual constraints seem to be suitable. According to Kline (2005),
“A general rule of thumb is that the minimum sample size should be no less than 200 (preferably no less than 400 especially when observed variables are not multivariate normally distributed) or 5–20 times the number of parameters to be estimated, whichever is larger” (as cited in Lei & Wu, 2007, p.36).
Model Estimation: A well-organized precise structural equation model has some set as well as free parameters which can be evaluated from the data.
Model Evaluation: After analyzing model parameters, there is a need of deciding by diving it into two parts, whether to keep hold of a hypothesized model or reject it. This static should necessarily be tested whether an illogical hypothesis about the model which is under consideration, fits the data or not. If a model is suitable for data and all the evaluations are accurate, individual parameters can be analyzed to depict statistical significance.
So knowing about structural equation modelling is exciting because of its adaptability but it could be frustrating for some since initially following it could be difficult for some (Lei & Wu, 2007).
References
Alasuutari, P. et al 2008. The SAGE handbook of social research methods, 2015. Web.
Bailey, K. 2008. Methods of social research. 4th ed. The Free Press: New York 2015. Web.
Bernard, H.R. 2011. Research methods in anthropology: Qualitative and quantitative approaches. Rowman Altamira: Plymouth, 2015. Web.
Bhattacherjee, A. 2012. ‘Social science research: principles, methods and practices.’ Textbooks Collection. Book 3. Web.
Bollen, K.A. et al. n.d. Issues in the structural equation modeling of complex survey data. 2015. Web.
Cargan, L. 2007. Doing social research. Rowman and Littlefield: Maryland, Web.
Creswell, J.W, 2003 ‘Research design: Qualitative, quantitative, and mixed methods approaches.’ Thousand Oaks, Sage Publications: CA
Cohen, L. et al, 2007. Research methods in education. 6thed. Routledge: London. Web.
E-government Benchmark Framework, 2012. Web.
Gideon, L. 2012. Handbook of survey methodology for the social sciences. Springer Science and Business Media: New York, Web.
Glasow, P.A. 2005. Fundamentals of survey research methodology. Web.
Heck, R. 2004. Studying educational and social policy: Theoretical concepts and research methods. Mahwah, Lawrence Erlbaum Associates: NJ Hine, D. & Carson, D. 2007. Innovative methodologies in enterprise research. Edward Elgar Publishing: Glos, Web.
Jaeger, R.G & Halliday, T.R.1998. ‘On confirmatory versus exploratory research.’ Supplement: Points of View on Contemporary Education in Herpetology, vol.54 pp. S64-S66, Web.
Kothari, C.R. Research methodology: Methods and technique. 2nd ed. New Age International: New Delhi, 2015. Web.
Lei, P. & Wu, Q. 2007. ‘Introduction to structural equation modelling: Issues and practical considerations.’ ITEMS. Web.
Nishishiba, N. et al. 2013. Research methods and statistics for public and nonprofit administrators. SAGE: London, Web.
Phillimore, J. & Goodson, L. 2004 Progress in qualitative research in tourism: Epistemology, ontology and methodology in Qualitative Research in Tourism: Ontologies, Routledge: New York, Web.
Research Methodology: An Introduction, n. d, 2015. Web.
Ross, J. 1999 Ways of approaching research: Quantitative designs, Web.
Sample Size Methodology, 2015. Web.
Sample Size, 2015. Web.
STATA structural equation modeling, 2013. Web.
Wahyuni, D. 2012. ‘The research design maze: Understanding paradigms, cases, methods and methodologies.’ JAMAR, vol.10, Web.
Wimmer, R. & Dominick, J. 2013, Mass media research, 10th ed. Cengage Learning: Boston, Web.
Zikmun, W. & Babin, B. 2006. Exploring marketing research. Cengage Learning: Boston. Web.