Introduction
Digital communication systems are undoubtedly the most commonly used nowadays. They are irreplaceable practically in every sphere of human life: studying, work, entertainment. This is due to several factors, which include:
- their accessibility;
- simplicity in use;
- their mobility.
In general digital communication deals with transmission of a digital bit stream, which forms some information content, over a particular transmission system. Such systems include fibers, wires, wireless communication systems, etc.
Almost everyone today has a cell phone or a laptop which enable people from different countries and continents to get connected with each other in few seconds. Practically every building utilizes the digital antennas, and very often people use such services as wireless internet. Everyone uses the mobile communication systems on a daily basis, but barely does anyone know how exactly they work.
Modern mobile communications use a number of extremely heavy signal processing. It is basically performed with speed coding and complex data signal modulation or demodulation. It can be stated that the basic technologies which are applied for signal processing are the IC, DSP, and FPGA. The digital cellphones usually have speech codecs installed, which allow them to receive signals of different length and frequency. Their aim is also to compress speech to some non-speech signals which, when represented, have the form of the initial speech.
Another significant function of the mobile communications is multimedia data transmission. Images, video and audio files of almost unlimited size can be carried and transferred, recoded and changed. This function is convenient and saves time, and therefore is wide-spread. In order to make this process possible, the special data service modes have been designed. They are aimed at carrying data on the cellular network and operate with the files of various formats. However, the most spread nowadays is the transmission of images. Different files, such as tables, schemes, pictures, photography can be sent and delivered with the help of different devices.
Their quality, which includes distinction, color, focus, and other characteristics, can vary according to the devices used. Specifically, even if the initial multimedia is of a good quality, it often loses some of its features after transmission. In addition, the greatest problem nowadays is saving the visual quality of the transmitted large-size data. A multitude of processes which can possibly influence this process should be considered. For instance, choosing an appropriate method of data compression, transmission and performance can preserve the visual image quality.
Studying the methodology and technological side of different operations with data can help to improve the results of working with it. It is extremely topical nowadays, when the mobile communication technologies are of a vital importance. Their users may find this thesis interesting, as it contains a lot of useful information about effective use of different elements of mobile communication systems. What is more, in order to be competitive in the society of demanding consumers, the quality of the mobile communications should improve constantly.
Thus, different companies together with scientific organizations might be interested in the results of the studies and experiments presented in this thesis, in order to develop the modern technologies and offer the better product for the consumers. The telecom companies which operate the networks can also be interested in the improvement of their service, which can be made with the help of the studies included in this thesis.
Power Line Communication
Power line communication (PLC) is a technology which is being studied and developed by mathematicians and engineers of the world for several decades already. In fact, it had been existing for many decades already, but the new ways of its applications were found comparatively recently. If earlier the explanation of this technology and its design could be only found in special books devoted to engineering, now it became so popular that almost everyone at least heard of it.
It means that nowadays you don’t need to be a scientist or an engineer in order to understand the PLC work; it is enough to simply be interested in digital technologies. The interest to this invention can be explained by the growing popularity of digital communication. PLC is assumed to become the most popular technology which will be used in every building by average consumers.
In recent years the need for greater bandwidth for broadband data in different networks has become crucial. This is due to the fact that the communication backbones are designed in a way which suggests a rather insufficient use of the band, which can appear to be very costly. The conventional DSL lines are vulnerable to different disturbances and are famous for the last mile connectivity problem; the other technologies like the well-known 3G also have disadvantages such as a lack of official standards and their limited spectrum. In these conditions, such services as Internet need a faster and more reliable system to be used.
PLC is being presented like a possible solution for the existing problems in digital communications. For example, it is expected to satisfy all the needs of both the consumer and supplier: its advantages like relative cheapness and efficient use of the bandwidth suggest its wide implementation in the nearest future. These are not just predictions, as many engineering companies are already competing for PLC standardization and implementation. In addition, the interest to this technology increased considerably because of its perspectives on the market: besides qualitative digital communication, there are many other spheres where PLC can be applied. Among them is the possibility of a fast and convenient access to Internet, which makes PLC even more desirable on the market.
Logically, there must be some positive features of PLC which make it beneficial to use. One of the major advantages of PLC for which it is popular is that its requirements for bit rate are not very high in comparison with the traditional systems. In addition, PLC is designed in a way which makes it capable of qualitative real time responses. This system is also being developed for providing a network to the indoor areas. With this aim, different methods of strengthening its signals have been offered.
However, despite of its numerous advantages, PLC is not being applied widely. Therefore, it can be stated that the system design needs further improvement in order to be more efficient for wide application. The disadvantages of the offered system will also be discussed in the further sections of this work.
What really needs to be understood about the power line communication is its nature which is basically different from the traditional communication systems. The usual way of producing the energy suggests using a network which generates, modulates, operates and distributes the energy; such network traditionally includes a power plant or station. PLC has a conceptionally new approach of the communication and signal processing. To make it short, I will just say that PLC is based on the interaction between the substations and consumers on the low-voltage grid.
In this thesis, PLC systems are analyzed deeply. Different experiments were conducted in order to observe the vulnerable and strong points of the system. In addition, various methods for improving the PLC design were presented.
OFDM
Orthogonal frequency division multiplexing has been a subject for many studies in last fifty years. However, the practical use of the system started relatively recently. This is due to the growing popularity of wireless communications.
OFDM is a technique of transmission of multiple signals through a transmission path. It is assumed to become the leader of such operations in the particular field.
The conventional schemes for signal transmission suggest using one carrier for processing a number of signals. However, these schemes can be problematic as far as the signals may have different frequencies and strength. Thus, one carrier can be incapable of sorting out the signals. OFDM is based on a different principle, which suggests using several carriers for different signals. This prevents them from interference with each other and therefore provides a qualitative performance of the system.
OFDM has a number of other advantages in comparison with traditional single-carrier schemes which make its popularity on the market grow. For instance, OFDM has a precious ability to resist the severe channel conditions such as fading, frequency attenuation, etc. The system is designed in a way that allows signal transmission to be realized with no equalizing filters, which makes the system simpler and cheaper.
The interest to the discussed scheme continues to grow with the need of a system which could provide consumers with spectral efficiency. OFDM is expected to meet all the mentioned requirements. In addition, it is very convenient in terms of computation: the traditional FFT algorithms can be used with this scheme.
However, OFDM has several weak points, which suggest that a deeper studying of the scheme is needed. For instance, this technique is not always capable of dealing with specific conditions; thus, it usually demands using the additional error correcting coding. Our task is to study OFDM functioning and find ways of its best performance.
Compression
Compression is a process which we face every day in digital world. Compression of data, video, images and many other types of files can be realized for different purposes. From the technical point of view, compression can be explained as information encoding with special units. It is applied when the size of an object has to be reduced in order to save the disk space during data storage or in order to preserve the bandwidth during data transmission through the communication systems.
In general, the image compression techniques can be divided into two main groups, which are lossy and lossless compression methods. The difference between the two methods is quite obvious. The first one is usually applied while working with data and artificial images; the second one is used when the maximum alikeness with the original is required. Lossy data compression algorithms are widely applied in practice; therefore, their detailed investigation will be held in this work.
The of data compression which are studied more deeply in this thesis are DWT, DCT and BTC. As any other algorithm, they have some advantages and disadvantages and are used for different types of systems and data. Their qualities, typical errors and performances in PLC system will be studied and compared later in the thesis. In this study, we will also present the detailed analysis of the properties of different families of wavelets besides the DWT, namely:
- Haar wavelets;
- Daubechies family;
- Symlets family;
- Coiflet wavelets;
- Biorthogonal wavelets.
Error correction
While doing different operations with multimedia, different errors are unavoidable. The transmission channel, the modulation scheme, and the compression method are all under a threat of being affected by some negative phenomena, such as noises, interferences or fading. Thus, some methods of their liquidation need to be introduced.
The most developed way of dealing with mentioned problems is application of the error correcting coding. Basically, it means modulation of a system in a way which prevents the undesirable result from occurring. There is a number of error correcting techniques which will be explained. We will briefly explain the principle of the popular Reed-Solomon coding and list some more techniques. However, the most attention will be devoted to BCH coding, which belongs to the family of Reed-Solomon codes and which has introduced itself as a reliable and efficient scheme for error correction in the communication channels.
Thesis objectives
Despite the fact that different methods of data compression and transmission have been practiced for almost a century, there are still problems which need a proper solution. For instance, loss of data quality is unavoidable; and working with large-size images is often inefficient. All the methods of operating the data have some advantages and disadvantages. Thus, this thesis is aimed at finding a paragon of all the operations mentioned above. This means investigating all the possible ways of operating the files compression and transmission in order to find the one which would guarantee the minimum loss of quality. In order to fully analyze a particular communication system, a range of factors should be considered. These are:
- possible effects of noises and interference on data quality;
- beneficial sides and disadvantages of the different compression techniques;
- requirements for an efficient work of a transmission channel.
All these factors will be studied in this thesis and considered in the experimental evaluaton.
Research questions
The proposed thesis attempts to answer the following questions:
- What type of image compression is the most efficient?
- What factors influence the loss of data quality?
- What methods of data transmission are the most reliable?
- How to maximally preserve the visual quality of compressed data?
- Can a transmission system be designed to perform a perfect result?
- How to avoid the distortion of transmitted data?
Research aims
According to the research questions, there are some objectives. They are as follows:
- Compare the different methods of data compression;
- Analyze the effects of different factors, such as link length, multipath, and impulsive noise on the compressed image transmission;
- Study the advantages and disadvantages of different ways of data transmission;
- Introduce different techniques of quality assessment;
- Apply several coding methods;
- Modulate the optimum conditions for preserving the visual data quality.
Original contributions
This thesis contains a number of original contributions to the studies which were made in the field of data compression and transmission. The theoretical and practical achievements were considered. In addition, new experiments were conducted in order to investigate the issues more deeply. The main contributions of the dissertation are as follows:
- Identification and thorough analysis of the main problems connected to data compression, transmission and related phenomena.
- Experimental evaluation of the FFT-OFDM and PLC channels.
- Comparative analysis of BTC, DWT and threshold.
- The unresolved issue of the noise removal.
Thesis organization
This thesis includes eleven chapters, which can be divided into three sections.
The firs section, which includes Chapters 3, 4, and 5, performs an introduction to the OFDM and PLC systems and different compression methods for images.
The second part, which includes chapters 6, 7, 8, 9, and 10, is devoted to the experimental study of the behavior of systems in different conditions. It contains comparisons of different compression schemes and communication systems behavior in different environments.
Chapter 11 is a conclusive chapter, which summarizes the results of the study and gives the directions for further work.
The thesis is organized in the following way.
- Chapter 2: Literature review. Firstly, the literature which was used as a basis for the thesis is analyzed. This chapter contains a summary of the experimental and theoretical work made by the researchers in the field of engineering. The main issues included in the thesis are introduced. In addition, the different points of view on the thesis issues are presented. The general information about subjects studied in thesis is given in the literature review section.
- Chapter 3: Introduction to OFDM and PLC systems. In this chapter, the general information about the OFDM and PLC systems is given. The systems’ advantages and disadvantages are analyzed, and a detailed description of their work is given. The variations of the systems and their possible applications are presented. OFDM system design is concluded to be suitable for the requirements of the modern wireless communications. PLC needs a deeper study in order to be implemented widely.
- Chapter 4: Methods of compression. This part contains an introduction to compression. The general scheme of this process is given; the basic kinds of compression are compared. In addition, a detailed description of different compression methods, their specific features and peculiarities of functioning is given. Such methods as DWT, DTC and BTC are discussed in detail. They are agreed to be suitable for different kinds of images.
- Chapter 5: Noises in communication systems. This chapter contains the description of different noises which are often present in communication systems, including the main types which are impulsive and AWGN noises. Their effects in the communication systems are analyzed. Impulsive noise is claimed to be more harmful; AWGN is admitted as a possible additive component for a particular purpose.
- Chapter 6: DWT, DCT and BTC coding schemes. In this chapter, the experimental evaluation of image transmission over FFT-OFDM is introduced. It contains the comparative study of the DCT, DWT and BTC for image compression. We also analyzed the various families of wavelets, such as Daubechies, Biorthogonal, and others. The criteria like spectral efficiency, compression ratio and quality degradation are considered. We also counted the SNR and RMS values.
- Chapter 7: Optimum wavelet thresholding. This section performs the structural similarity quality assessment method for wavelet thresholding; it is also illustrated with the FFT-OFDM model. The optimum wavelet thresholding is presented as an alternative to the compression method introduced earlier. We studied the intersection between the zero-clusters and the Structural Similarity index curves as a thresholding algorithm.
- Chapter 8: BTC and DWT for PLC. This chapter contains a comparison of BTC and DWT compression algorithms for image transmission using FFT-OFDM over PLC channels. In addition, the additive white Gaussian noise (AWGN) and impulsive noises and their impact on system performance are studied. We tried to find out which compression method is more vulnerable to the noisy environment.
- Chapter 9: PLC performance under different conditions. This chapter is devoted to the transmission of the compressed images over PLC channel. This section also includes the description of the effects which the impulsive noise, multipath and link length cause and the means of their liquidation. We also compare the two types of impulsive noise, asynchronous impulsive noise and periodic impulsive noise synchronous to the mains frequency. As far as the mentioned phenomena are unavoidable in power line communications, their analysis is of a vital importance.
- Chapter 10: Performance of BCH Coding on Transmission of Compressed Images over PLC Channels. This chapter describes the implementation of BHC coding on the transmission over PLC channels and its results. It is based on comparison between BTC compressed and uncoded system. We also observe the performance of the BCH coding scheme in a noisy environment, namely in the impulsive scenarios.
- Chapter 11: Conclusions and further work. The conclusion part summarizes the survey results and achievements. In this chapter, we systemize the theoretical and practical material and highlight the most important discoveries made during the research work. It also contains the suggestions for further work on the topic; we show the other scientists all the aspects of this sphere which need further investigation.

Literature review
The recent intensive development of digital technology allows doing a multitude of operations with data, in particular with images. It includes their compression, transmission, decoding, representation, etc. Taking into consideration the great demand for the high quality of images, there is a need to investigate every of the stages of working with it. This will allow organizing all the conditions in a system properly in order to maximally preserve the quality of the images.
The question of the quality measurement is still being discussed by scientists. Despite the fact that there is a number of quality assessment techniques proposed [1; 2; 3; 4], choosing the one which would be the most objective is a challenging task. There are still questions which remain unanswered, such as:
- what criteria should be considered to evaluate the image quality fully?
- how can the process of evaluation be automated?
Thus, it is worth applying all the offered techniques and introducing some minor changes in their schemes in order to find a paragon which would satisfy the customer’s need and meet the technical requirements. In addition, it should be taken into consideration that different quality assessment methods might be more or less suitable for different types of images [4].
There are also other issues which need to be studied more. For instance, if the principles of OFDM system design and work have been explained in detail [5; 6; 7;], the improvement techniques for the system organization have not been studied enough. These techniques are worth developing, as far as there is a great risk of the failure in system performance due to various factors [7; 8]. In addition, OFDM is becoming more and more popular among all the schemes for modulation; it is used very often for broadband communication in a wireless multipath environment. This system is expected to serve as a reliable model for the next generation wireless local area networks.
OFDM is also predicted to be used for broadband fixed wireless access networks. However, although the theoretical background for OFDM is well-developed, the application aspects of the system still remain a challenge and need a deeper investigation [8].
The other technology, which is PLC, is also very promising in the world of digital communication. Despite the fact that PLC systems are being studied and developed for several years already, there are still some issues which restrict the new technology and prevent it from being widely applied. These issues were investigated [9; 10; 11; 12] and they still need some ideas to be implemented in order to make BPL accessible and convenient for users. In addition, a number of failure scenarios for the system, such as interference with other systems or signal attenuation by active or passive devices need a deeper investigation and new solutions.
One of the greatest problems which appear on a regular basis and are hazardous for image quality is noise. Its various types and their effects on different systems have been studied by many scientists [10; 13; 14; 15; 16]. The ways of noise neutralization have also been analyzed thoroughly through experimental evaluation. However, the number of possible combinations of different types of noise and different systems is infinite; thus, the further experiments need to be conducted.
Another operation which demands a deeper analysis and which is included in all of the experiments in the thesis is image compression. It is a well-known fact that there are two main types of compression, which are lossy and lossless, each suitable for different kinds of images [17; 18; 19; 20; 21]. The most popular compression algorithms are DWT, DTC and BTC. These methods have been a subject for different studies for many years. Their applications separately and in combinations have been observed under different conditions [18; 22; 23; 24; 25]. Their efficiency for different types of images, however, needs more analysis.
Since this thesis is devoted to the different methods of data compression and transmission, it was important to investigate the experiments and their outcomes which were made previously. Therefore, in this chapter we attempt to analyze the works of some scientists who have contributed into the study. The definitions and classifications of the compression methods, noises, and other key issues of the thesis given by different authors served as a basis for the current study; thus it is necessary to mention them all.
The experimental results of different surveys connected to the thesis topic were considered and developed in the thesis. Therefore, the experiences of the scientists who worked in the particular field are discussed in this chapter. In addition, the main problems of the studied systems discovered by different scientists are named in order to be discussed and solved later in the thesis.
The literature used in the thesis contains mostly scientific publications related to the issues raised in the thesis; it also includes some books and scientific papers. The articles were predominantly presented in the IEEE conferences, transactions on different topics etc, which points to their scientific value on the international level. The choice of a particular work to use was made according to its relevance to the problems and issues which were discussed in the thesis.
OFDM
With the growing popularity of the wireless multimedia service, there appeared a need of introducing a system which would be capable of high-speed modulation of the data. In addition, the preserving of the quality and spectrum efficiency are highly demanded nowadays. OFDM is now being developed by scientists as an optimal variance of such systems.
Orthogonal frequency-division multiplexing (OFDM) modulation is a promising technique which design allows achieving the high bit rates which are required for a wireless multimedia service nowadays [5]. Referring to the system organization, it is a technique for the modulation of digital information onto an analog carrier electromagnetic signal. In fact, an average OFDM signal consists of several orthogonal sub-carriers, which are modulated independently on their own data [6]. The simplest OFDM system includes a transmitter and a receiver, which are shown in fig. (1) and fig. (2).
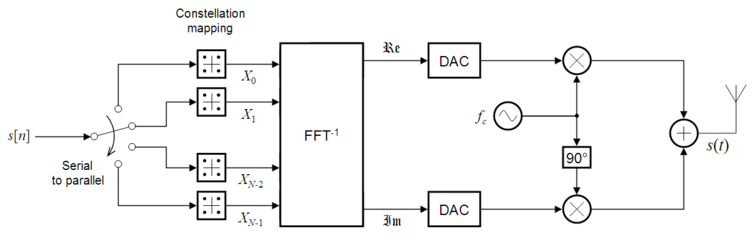
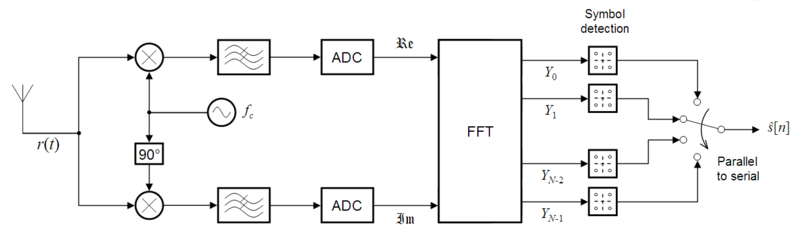
In the figures, s[n] stands for a serial stream of binary digits; r(t) is a signal picked up by a receiver [7].
In order to conduct the experiments with OFDM system, it is worth studying all of its types. A detailed classification is given in [5]. COFDM is a very popular kind of OFDM. Its main advantage is the combination of multicarrier and coding, which suggest the efficient work of the system. The two basic rules for COFDM proper functioning are:
- to use the channel information from an equalizer in order to provide the reliability of the received bits;
- to take the bits from the source data and spread them among the subcarriers, which means coding the bits earlier than IFFT.
Multiple input, multiple output OFDM (MIMO OFDM) is a technology which is also aimed at transmitting and receiving the radio signals. The interesting peculiarity about this system is that for this purpose it uses a number of antennas. MIMO-OFDM is expected to provide the broadband wireless access (BWA) system that does not have the line of sight. The MIMO-OFDM was constructed by Iospan Wireless and is very beneficial because of the resistance to signal interference.
Unlike the traditional systems, the MIMO system transmits data simultaneously through a number of antennas. The data flow is divided into small portions which are easier to operate for the receiver; this process is called spatial multiplexing. The general rule in this case is: the more antennas are used for transmission, the less time is needed for the process; in addition, the spectrum is very efficient due to the same frequencies but separate spatial signatures [7].
Among the other versions of OFDM is the popular in the field of signal processing wideband OFDM (WOFDM). Its main feature is separating channels on a distance which prevents the transmitter and receiver frequencies from interference. This protects the performance from being degraded by the possible interference. Another technology is the flash OFDM, which can also be called “fast-hopped OFDM”. Its principle lies in using multiple tones in order to spread the signals on a high speed over a particular spectrum band.
The band segmented OFDM (BST-OFDM) has an advantage of its flexibility. Namely, they allow modulating some OFDM carriers in a different way comparing to others within the same multiplex. Such a hierarchical modulation suggests that a set of signals can be modulated differently and therefore used for different purposes. This scheme was introduced in Japan, namely in the ISDB-T, ISDB-TSB and ISDB-C broadcasting systems [7].
OFDM is very beneficial for a set of reasons. For example, it has a very high level of noise resistance. It also can regulate the upstream and downstream speeds by means of allocating either more or fewer carriers for different purposes [8]. OFDM also has the advantage of resistance to various types of disturbances. This system is capable of mitigating the negative effect of the impulsive noise. It is also proved that the OFDM BER performance can be hardly affected by the noises [5].
OFDM is an irreplaceable technology when a number of narrow subchannels signaling at a very low rate need to be multiplexed into one high-rate channel. This technique can significantly reduce the effects of flat Rayleigh fading with a minor pilot-based correction. In addition, it can significantly improve the signal-to-interference ratio [26].
Undoubtedly, there are also some problems which can appear while using OFDM. As a result of numerous investigations, there were different methods introduced for improvement of the OFDM functioning. Specifically, the channel variations during one OFDM symbol tend to cause an inter sub-carrier interference (ICI) in OFDM systems, which degrades the performance, since ICI can be seen as additional near-Gaussian noise [7]. In this case, the ICI can be minimized with the frequency correction of the receiver. The application of a robust channel estimator proved to significantly improve the performance of OFDM systems in a typical rapid dispersive fading channel [27].
Another technique which can be used in order to improve OFDM functioning is the minimum mean-square-error (MMSE) channel estimator, which efficiently uses the time- and frequency-domain correlations in the time-varying dispersive fading channels. The other vulnerable aspect of OFDM system, namely its BER performance can be improved by application of the advanced guard interval for the system [5].
The scheme can be also combined with other systems in order to provide the efficient functioning. For instance, a combined SPIHT/OFDM coding scheme for images transmission proved to be highly effective in the challenging conditions of the wireless fading channels [25].
Taking into consideration the deep analysis of the discussed scheme, it is worth improving the system and increasing its efficiency. The experimental evaluation of OFDM in different conditions can help to design the system in a way which would be suitable for the demands of modern wireless multimedia service. Thus, a more detailed description of OFDM principles and possible improvements will be presented later in this thesis.
PLC
The recent technology development seems to have caused a real revolution in the field of the electric power distribution. The need of a reliable system for data transmission which would be accessible and convenient became crucial. Therefore, PLC can be treated as a technology suitable for such services.
The power line communication (PLC) or its close variance, broadband over power line communication (BPL) uses the electric grid for different kinds of data transportation [9]. This technology is capable of providing such services as grid management, high speed Ethernet, automated motorized switches in medium tension, digital telephony, remote reader, and residential automation. However, in order to develop the PLC systems for Internet, voice, and data services the measurement-based models for the mains network are required [12].
The principle of BPL work can be explained by listing the several key steps:
- The utility installs the PLC adaptors at centralized locations and by this means connects the internet to its electric distribution lines.
- The adaptors receive internet data and remodulate it to special frequencies that can be combined with electricity and transmitted over the distribution lines.
- The endpoint modems separate the data from the electricity, sending the data to an Ethernet port [9].
The opportunities which BPL gives to the customers suggest that in order to get an access to the high-speed Internet, the BPL modem will only has too be inserted into an outlet with a special codec installed.
However, despite the fact that different companies like the International Broadband Electric Communications (IBEC) promote the BPL service, there is still a lack of current IEEE standards for this new technology. In addition, the physical characteristics of the electricity network are far from clearly defined [5]. These facts point to the inability of the service to be suitable for a regular provisioning and consuming. In order to make it possible, a legal framework for the discussed technology is needed. Despite the fact that PLC works with a particular frequency band, it can be classified both as a telecommunications network ad as an electrical network.
This division of functions causes confusion when there appears a need to define a particular framework for PLC systems. Thus, more work should be done in order to introduce the official regulation for PLC systems implementation. It has been proved however, that installation of PLC networks indoor is safe enough. It is stated to cause no negative side-effects to the other equipment [9].
In addition, there are some doubtful points about the system, such as if the amount of bandwidth which can be offered by a BPL system is greater in comparison with that provided by a traditional cable.
Notwithstanding the mentioned problems, the system has a multitude of other issues to be considered. Namely, PLC can be considered as a vulnerable system in some respects, mostly because of its sensitivity to noise [5]. In practice, if a consumer uses BPL in a particular building, their line will be intervened every time some electric device is plugged into a socket or starts working in the same building. In addition, even in conditions where there are no disturbances caused by different devises, the noise can be performed by energy-saving devices. This feature makes PLC rather inconvenient and restricts its usage comparing to other modern technologies. Thus, it is worth considering different methods to demodulate this system so that it would be able to resist the noise and other kinds of disturbances.
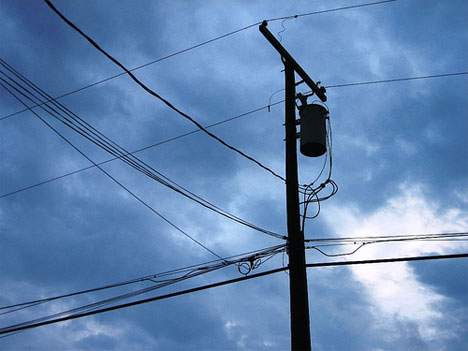
Another problem concerning the system is a need of having a signal which would be strong enough and an appropriate frequency. Traditionally, the shortwave broadcasting, radio operating and various communication systems work with frequencies of 10 to 30 MHz [9]. The BPL design suggests using the same frequencies. Thus, an application of OFDM modulation in the system can improve its work significantly. Its implementation is made in order to avoid interference with signals of the shortwave radio communication which is highly possible in case of working with PLC, which function like antennas for the carried signals. OFDM is beneficial as it allows sorting out the frequencies and using only those which are needed.
One more issue which needs a deeper investigation is the need of limitation of the BPL propagation mode. In an average system it has no potential to be more than 80 MHz, which can cause a lot of inconveniences; namely, such propagation mode suggests that the system has to share its spectrum with other licensed and unlicensed services. As a result, interference with signals of those services can appear. This points to the inflexibility of the BPL modulation [9].
Summing up all the specific features of PLC it can be stated that this technology has a number of advantages together with serious imperfections. Being a very promising system, it needs further analysis and development. Thus, this thesis is partially devoted to deeper analysis of PLC systems and dealing with their negative features.
Image compression techniques
Compression with various methods is being used in every sphere of human life. The images on the Internet are compressed; most modems use compression; HDTV are also compressed, and several file systems automatically compress files when stored. The typical formats for the mentioned files are JPEG, MPEG and GIF. It is also worth mentioning that there is a number of algorithmic tools, such as sorting, hash tables, tries, and FFTs, which are used in the compression techniques. The algorithms which have a good theoretical basis are most widely applied today.
The process of compression can be described as the modulation with a proper coding [28]. The first operation requires the application of vast knowledge, and therefore is easier for humans to be realized; the second one deals with deterministic computation, and that is why is mainly realized by computers.
Basically, there are two main types of image compression, which use lossy algorithms, which can reconstruct an approximation of the original message and lossless algorithms, which can reconstruct the original message exactly from the compressed message.
One of the main questions about the different compression algorithms is how can their quality be evaluated and compared. In case of lossless compression there are several criteria, which are the time needed to compress, the time needed to reconstruct, the size of the compressed messages, and the universality.
The evaluation of lossy compression efficiency, however, is more complicated because the lossy approximation should also be considered. The amount of compression, the runtime, and the quality of the reconstruction should always be balanced. In addition, depending on the type of application one feature might be more important than another. Therefore, the systematical comparison of the lossless compression algorithms is most often realized with the help of the Archive Comparison Test (ACT) offered by Jeff Gilchrist. Its assessment is based on reporting the endurances and compression ratios for hundreds of compression algorithms using many databases. Using this technique can also help to calculate the score of a weighted average of runtime and the compression ratio [20].
Undoubtedly, data compression is of a vital importance in the modern technology. For image compression different methods can be used. However, DWT, DCT and BTC are the most popular and convenient.
DWT
Discrete wavelet transform (DWT) is one of the most widely used techniques of data compression. The idea of the first DWT scheme belongs to Alfred Haar, a mathematician from Hungary. This type of wavelets forms pairs of the input values in case when the input consists of a number of 2n numbers [22].
The most commonly used wavelets were designed by another mathematician, Ingrid Daubechies. Daubechies derives a family of wavelets and investigates principles of their work, which is a great contribution to the particular field.
The variety range of discrete wavelet transform is very wide; besides the mentioned types of wavelets, it also includes the undecimated wavelet transform, which omits the downsampling; the Newland transform, which is famous for the effective filters in frequency space; wavelet packet transforms also referred to as complex wavelet transforms, etc. [29].
The different kinds of discrete wavelet transform are being used in various fields of science, engineering, mathematic and computer science. One of its main applications is for signal coding, which is strongly connected to data compression.
Assuming the DWT signal is x, its calculation can be made with filtering it in different ways. First the DWT signal is passed through a low pass filter. Assuming the impulse response to be g, we get the next convolution:
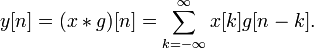
This procedure can show the approximation coefficients. Then the signal is also decomposed through a high-pass filter h, which gives the detail coefficients. The important condition for this process is the connection between the filters [22; 29].
In some cases DWT can be used in combination with other compression methods. For instance, it has been proved that the use of the absolute moment block truncation coding (AMBTC) and adaptive AMBTC in discrete wavelet transform (DWT) domain can provide a high compression factor of 16:1 and a bit rate as low as 0.5 bit/pixel with acceptable image quality [29]. DWT also proved to be particularly well adapted to progressive transmission, which can provide a fast recognition of the picture at the receiver [30].
There are also some situations, when DWT can be used in order to improve the system’s work. Specifically replacement of the DCT with DWT in JPEG framework can make the coder more complex but at the same time save the buffer space [31].
There are different methods developed in order to use DWT more efficiently. Specifically, the energy efficient wavelet image transform algorithm (EEWITA) is far less complicated in terms of computation and suggests a minimal degradation of an image quality. This algorithm is beneficial as far as it allows saving the communication energy and service cost [32].
DCT
The Discrete Cosine Transform (DCT) is a widely used method of lossy data compression. This is due to its strong energy compaction property, which is the ability to concentrate the signal information in a few low-frequency components [29]. DCT represents a signal with a number of sinusoids which are modulated to have different frequencies and amplitudes. The two-dimensional DCT is one of the most spread forms, as it is required in many image compression applications such as HDTV [33].
The simplest mathematical expression of different kinds of DCT is given in the next formulae.

Unlike the other types of DCT, which can be defined for any N>0, DCT-I requires N>2.
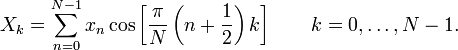
The DCT-II can be defined in case when xn is even around n=-1/2 and even around n=N-1/2 and Xk is even around k=0 and odd around k=N.

This type of DCT can be defined when there are conditions as following: xn is even around n=0 and odd around n=N; Xk is even around k=-1/2 and even around k=N-1/2.

The DCT-IV implies such boundary conditions: xn is even around n=-1/2 and odd around n=N-1/2; similarly for Xk.
There is also an algorithm which is used in order to define the inverse DCT. Generally, an inverse version of a DCT can be defined by multiplying the original DCT by 2/N [34].
Despite the numerous advantages of the technique, implementation of DCT can be inconvenient. One of the main problems connected to DCT is that its computation is often complicated. The traditional algorithms suggest using the row-column method, which mans that a multi-dimensional DCT can be defined by sequences of one-dimensional DCTs along each of the dimensions. This method is rather inconvenient as it involves complicated matrix transpositions. Therefore, it is extremely important to find other ways of computation of DCT, which would be more convenient. Specifically, the two-dimensional DCT equation can be expressed by the sum of high order cosine functions. Thus, the combination of a highly efficient first order recursive structure with some simplified matrix multiplications can simplify the routing and make the hardware structure permanent [33].
There are also other ways of simplifying the procedure of the DCT computation. One of them is using a triangle function transforms and Taylor series expansion in order to express DCT in terms of discrete moments. In this case, no cosine evaluations are needed and only several multiplications have to be done. [34].
Inspite of the computation inconveniency, DCT has a lot of applications in modern technologies. For instance, it is used in the popular JPEG image compression, where the two-dimensional DCT-II of N x N blocks is computed (where N usually has the value of 8). Next, the computed results are quantized and the entropy is coded.
The other kind of the technology, modified discrete cosine transform (MDCT) is applied in AAC, WMA, and MP3 audio compression. A fast DCT algorithm is used to fasten the calculations of DCT in case when the quantization step size is large [34]. The same algorithms are also being used in some of the Chebyshev polynomials [34].
All in all, it can be said that DCT is a very promising technique for data compression which is very widely used in operations with multimedia. Its functioning has been studied for many years and its further exploration will help to improve the method and its effects.
BTC
Block truncation coding (BTC) belongs to the family of lossy image compression techniques for greyscale images. Basically, its work can be explained as a division of the original images into blocks and using a special quantiser to reduce the number of grey levels in each block. In addition, the mean and standard deviation remain unchanged [22].
Block truncation coding uses a one-bit nonparametric quantizer. It is capable of adapting to the local properties of the image and also preserves the local sample moments and provides the good quality of the images. As a consequence, image quality is enhanced; what is more, this quantizer needs a comparatively small computation and no of large data storage [22].
BTC has a number of advantages, such as simplicity of use, ability to save the maximum quality while working with noisy images, a relative resistance to channel errors [24]. It also does not require multiple passes through the data, which is very convenient.
BTC functioning can be improved with some minor changes in the scheme. For instance, it gives an opportunity of selecting the optimum bit-pattern instead of modulating a separate bit-pattern for every block [24] This algorithm can be used in combination with other methods in some particular cases. For example, the use of the absolute moment block truncation coding (AMBTC) in a discrete wavelet transform domain can increase the compression factor to the value of 16:1 and decrease the bit rate to the level of 0.5 bit/pixel [18]. The image quality in this case will not be affected seriously.
Like the other methods described, BTC will be used for different experiments which will be presented later in the thesis.
Causes of errors
Every stage of operating with multimedia has its own peculiarities which might be hazardous for its quality. The phenomena like noises and multipath are inevitable, and their deeper investigation can help to find ways of dealing with the possible negative effects.
The impulsive noise and multipath effects proved to be the main reasons for the hazardous bit errors in power line communications [10]. The heavily disturbed impulsive noise can even distort the BER performance of the OFDM system, degrading the system’s performance. The multipath channel proved to be even more harmful for OFDM system [12]. It is likely to cause such phenomena as intersymbol (among te subcarriers from different systems) and intrasymbol (among the subcarriers which belong to a single system) interference OFDM, which, as a rule, degrades the quality of transmitted data [10].
It was established that noise bursts on powerline conductors occur on a regular basis during the 60 Hz cycle. Moreover, the transmission bit errors were observed to coincide with these noise bursts [35]. Thus, studying different techniques for their liquidation is needed.
Different techniques are being tried in order to avoid the undesired effects of noise. Some scientists offer noise distribution as one of the effective methods. The experimental evaluation showed that for non-fluctuating signals the noise distribution is extremely important, as far as spiky noise tends to produce performance impairment. What is more, the maximum performance in impulsive disturbance may show serious deviations from the well-known stepwise shape which is typical of Gaussian channels. For deep fading, however, the noise marginal distribution does not influence the error probability significantly [14].
The effects of impulsive noise can also be controlled or prevented by other methods. For instance, in the low density parity-check coded OFDM a special estimator can be applied in order to overcome the conditions which degrade the system’s work. This estimator is based on the Gaussian approximation with estimated channel information (ECI) and a signal level limiter [36]. The application of this method will help to preserve the signal strength and data quality.
The effects of noise, however, appeared to be less harmful than those of some other factors. For instance, the experimental evaluation showed that the adverse effect of impulsive noise on a communication system is less serious than that of a multipath [5].
However, some kinds of noise can sometimes be introduced in a system with a particular purpose. For example, a noise shaping bit allocation procedure can be used in order to encode the wavelet coefficients. This procedure is based on the general assumption that human eye is less sensitive to details at high resolution, which therefore might appear less visible [30]. Additional noise can be introduced for a picture in order to make details more distinct; the key point is to find the noise which would be suitable for a particular picture’s tone and brightness.
Multipath and noises are inevitable while working with data. Thus, knowledge of their kinds and specific features will help to prevent it or exploit it to achieve some positive effects.
Error correcting techniques
Taking into consideration the possible errors discussed earlier, there is a need to investigate different ways of their neutralization. There is a number of coding techniques which are being developed in order to correct the negative effects of such phenomena as different types of noise or multipath channels which are typical of modern communication systems.
There are two basic kinds of coding which can be used in OFDM systems for error correction, which are convolutional coding and Reed-Solomon coding [37]. The former one is used as the inner code for correcting the errors inside a system; the latter is considered to be an outer coding technique. They are usually applied as a combination and sometimes used together with interleaving. The motivation of such choice of coding systems can be explained simply. While the convolutional coding uses decoders which tend to cause error bursts which only last for a short time, Reed-Solomon codes are designed specially for dealing with this kind of errors
However, the development of modern technology continues improving the existing systems. Thus, there are many different techniques invented for error correction. For instance, the new advanced error correcting algorithms are based on the principle of turbo decoding and are used in such codes as LDPC or turbo codes [15]. This method suggests the iteration of a decoder towards a particular solution for a problem. These coding systems are sometimes used in combination with other techniques, such as Reed-Solomon coding or BCH codes, with a purpose of improving their effectiveness in a wireless channel due to the fact that the performance of turbo coding is limited.
Another method of error correction, which was mentioned above, is called frequency interleaving. In case of its application, the system becomes the advantage of resistance to frequency-selective channel conditions such as fading [38]. Even in case of a partial fading of a channel bandwidth the implication of this method prevents the bit errors from being concentrated in one location. In fact, interleaving is responsible for spreading the bit errors so that it would be easier for the system to correct them. Thus, this method is effective for protecting the system from severe fading. As an example, in OFDM systems interleaving is widely used [39].
Some specific features of this technique, however, might be not very beneficial in many cases. Namely, the slowly fading channels often cannot be regulated by a simple time interleaving. Another problem, which is the flat-fading in narrowband channels where the whole channel bandwidth is faded at once also cannot be corrected by frequency interleaving [40].
One of the most popular techniques for error correction is long Bose–Chaudhuri–Hocquenghen (BCH) coding. They are used in various channels such as PLC as the outer correcting codes. They are traditionally applied in the construction of a linear shift register feedback. In comparison to the mentioned above Reed-Solomon coding, BCH applied in long-haul optical communication systems is proved to have 0.6 more of coding gain [41; 42].
In order to neutralize the effects of multipath in OFDM systems, there can be few methods implemented. For instance, guard interval prevents the performance from being degraded in case of intersymbol interference. The effects of the intersymbol interference can be avoided by implementation of the cyclic prefix or discrete-time property [4].
All in all, there are various methods for error correction. Indisputably, a particular system needs a specific coding which is the most suitable for it. Therefore, a part of this thesis will be devoted to comparison of different error-correction codes efficiency in different systems.
Quality assessment techniques
The results of functioning of the transmission systems and compression methods described above can be calculated and defined by various formulae and data. But the most obvious outcomes of their work can be found in the level of quality of the operated data. Undoubtedly, it is vital for different operations with images to measure their visual quality. However, the issue of choosing an appropriate quality assessment technique often remains unsolved.
The goal of quality assessment (QA) algorithms is to modulate some algorithms which would enable to assess the quality of images in a way which would coincide with subjective human evaluation of the quality. In other words, the quality assessment algorithm should be designed in agreement with human perception, independent on the image content or the type and strength of the distortion of the image. There is a number of possible imperfections, which include smoothing and structured distortion, image-dependent distortions, and random noise [43].
There are three main types of the approaches, which are:
- full-reference quality assessment;
- no-reference quality assessment;
- reduce-reference quality assessment.
The method of full-reference quality assessment suggests an assumption of a ‘reference’ image which is identical to the original and comparing the resulting mage to the reference one. Logically, the loss of quality in a distorted image as a result of some processing on the reference is assumed to be related to its deviation from the perfect reference [1]. However, sometimes it is simply impossible to set a reference image due to different factors. In this case, the no-reference or so-called “blind” quality assessment approach can be helpful. There are also situations when the reference image is only partially available, for example when only some distinguishing features or general description of the original image are noted. That is one of the cases when the reduced-reference quality assessment is irreplaceable [43].
The QA method can be used to predict the subjective image quality within a non-linear mapping. Furthermore, as far as the mapping is likely to depend upon the subjective technique and its application, it would probably be most efficient to apply it at the end, but not as a component of the QA algorithm [3].
Talking about the quality assessment techniques, it is worth mentioning the blocking measurement methods. In general, blocking can be explained as a phenomenon of periodic horizontal and vertical edges, which usually occurs as a result of block-based compression algorithms. The blocking measurement methods are aimed at calculating the blocking either in the frequency domain or in the spatial domain. They are based on the general notion that the original images are smooth and not blocky [2]; logically, the smoother the image is, the better is its quality. These methods, however, can be rather inaccurate, as in some cases the blocky areas are demanded in pctures, for example when the objects have to be extremely vivid.
Some scientists argue that in order to measure the level of image distortion the structural distortion should be calculated [4]. This assumption is made due to the ability of human perception to evaluate the structure of the object rather than its view.
All in all, there are different techniques invented for quality assessment of the data. Knowledge of the system specific features and possible effects of various operations with data allows choosing an appropriate quality assessment method for a particular situation.
Summary
A brief literature survey about the thesis issues is conducted in this chapter. OFDM and PLC are very promising techniques, which have been studied and developed for several decades already. They have a very high potential to become the next generation technologies for data transmission and signal processing. However, beside the multitude of advantages of the mentioned systems, there are a lot of points which need to be improved. For example, the vulnerability of both systems to noises and interference makes their use rather inconvenient.
Further work on this technologies’ design will allow their wide implementation for wireless multimedia communication. Thus, improvement of their work is of a vital importance, and this thesis is devoted to this issue.
The two basic kinds of image compression, lossy and lossless, are studied in this thesis. They can be realized in different ways depending on the particular purpose and type of algorithm. The most popular techniques in this field are DWT, DCT and BTC. They should be used in different situations according to the type of data and desirable effect. We will pay special attention of the implementation of these techniques for PLC system using the OFDM modulation scheme. In order to achieve the best results of compression, various combinations of the mentioned methods in different channel conditions have to be tried.
However, an appropriate transmission system and a compression method are not enough to guarantee a total success of the operation. Some phenomena, such as multipath and various kinds of noise are unavoidable in communication systems. Thus, there have been different methods developed for liquidation of their negative effects. The techniques like convolution, time and frequency interleaving and BCH coding are most often implemented and therefore should be studied more deeply.
Another issue which is studied in this thesis is the evaluation of the processed data. The quality of the operated data can be assessed by different methods, which have been studied by different scientists. The general tendency is to use methods which are most objective and do not require a complicated computation.
All the literature which had been mentioned in this chapter was used in the thesis as a fundamental data. The experiences of the recognized in the field of electric engineering scientists were very helpful for the studies presented. They served as a basis for the further work with the raised issues, which are all included in the thesis.
PLC and schemes for its modulation
Science can amuse and fascinate us all, but it is engineering that changes the world. Isaak Asimov.
Due to the increasing application of digital multimedia, new broadband communication systems need to be designed. Orthogonal Frequency Division Multiplexing (OFDM) is a method for data transmission which is widely used for working with digital multimedia. For example, it is being applied as the European TV (DVB-T) and radio (DAB) standard [40]. The increasing interest for the system can be explained with its capability of transmitting high data rates in frequency – selective channels. In addition, its complexity is relatively low, which increases its popularity among consumers.
OFDM is very beneficial in comparison with other modulation systems. For instance, the FDMA systems, which use a single channel, face a problem of spectrum waste. This is due to the fact that the bandwidth of a channel is usually made up to ten times bigger than needed in order to avoid the interference among channels [57]. Using another system, namely TDMA, can also be inconvenient for it suggests a high symbol rate in the channels which may become a reason for problems with multipath delay spread. In this chapter, OFDM design will be presented in order to prevent the mentioned problems.
The technology which is designed for transmission of voice, video and data and besides uses the mentioned OFDM coding is PLC (Power Line Communications). This scheme uses the power wiring, low voltage distribution network, and high voltage transmission network; in other words, for OFDM, the conventional power line infrastructure is needed [5].
PLC can provide all the services which the telecommunication providers offer with its speed of data transmission of 200 Mbps [11]. Moreover, its cheapness makes PLC advantageous on the market, as it uses the current power distribution lines and does not need their modification.
Modulation schemes
When talking about modulation, we usually mean the process of converting the data for its transmission. As the transmission of the information is realized through some mediums (in our case – power lines), it needs to be encoded in order to be delivered to the final point. For this purpose, the various modulation schemes are used.
There are a number of modulation schemes used in digital technologies. In general, there are two types of modulation; namely, analog modulation and digital modulation [44]. We will try to briefly describe the both types of modulation techniques and their main schemes.
Analog modulation
Analog modulation is used with the signals which carry some analog information. This modulation technique is aimed at modulating such properties of a carrier as frequency, amplitude, or phase [7]. In general, we can outline some positive and negative sides of the technique, which are present in every of its schemes. For instance, among the benefits of the analog modulation are the use of linear modulators and modifiers instead of digital circuits, simplicity of modulation and demodulation processes, etc. The disadvantages of the modulation include the diffusion of information comparing to that in the digital modulation, great amount of power demanded for modulation and others [44].
The analog modulation includes several techniques. The most commonly used are AM, PAM, FM, SM, and QAM. In this section, we will give the general characteristics of every scheme, outlining their peculiarities. We will try to explain the principles of their work and outline their advantages and disadvantages.
AM
AM stands for “amplitude modulation”. As it can be derived from the name of the technique, the main principle of the scheme’s work is based on changing the amplitude of a signal. In other words, the technique is aimed at controlling the strength of the transmitted signal according to the transmitted data. By varying the signal’s strength, the technique can either accentuate or diminish some of the information’s properties.
As it was mentioned, the amplitude modulation as a type of analog modulation techniques has some disadvantages, such as great power consumption [7]. However, there are also advantages, such as the simplicity of the technique and no special equipment needed for it’s use.
PAM
PAM is one more method of analog signal modulation. Specifically, the Pulse-Amplitude Modulation is one of the simplest ways to modulate the signals with pulse. This scheme is used with the purpose of carrying the information and producing other pulse modulations. The pulse-amplitude modulation is usually applied when the analog signals need to be changed into discrete. There are also situations when the carriers have a stable frequency; in such cases PAM can be used to change the frequency or amplitude of a signal. Namely, the pulse-amplitude modulation changes the amplitude of individual pulses according to the amplitude of a modulating signal.
This operation is realized with unchangeable position of the pulses and in a regularly timed sequence. In order to make the final signals digital, the number of pulse amplitudes usually has a power of two [8]. One of the PAM signals’ advantages is the fact that they are easy to demodulate. In addition, the design of PAM’s transmitter and receiver is rather simple, which makes working with the scheme convenient.
Among the disadvantages of PAM is the high level of sensitivity to noise and interference. This is due to the change of signal amplitude caused by the interference, which can make the signal incomprehensible for the modulation scheme. Therefore, because of its susceptibility to interference, PAM is rarely used. However, there are some spheres where it is applied; for instance, PAM is used for modern Ethernet communications [45].
FM
FM, or frequency modulation, is another technique of the analog family. This abbreviation is familiar to everyone who listens to the radio. Indeed, FM is most often used for broadcasting of the sound data at VHF radio frequencies. Besides radio transmission, this type of analog modulation is used for spaceships connection, TV broadcasting and has other applications [45].
In contrast with the mentioned types of modulation, FM deals with the frequency of the information. Varying the frequency of the signal, the technique allows either increasing or decreasing the amount of transmitted data or varying its properties. For example, when FM is applied in radio broadcasting, the greater frequency of the signal will mean the intense information, while the lower frequency will mean less information transmitted. Thus, the silence in the radio wave means a low frequency of the signal.
PM
One more technique for analog modulation is PM, or phase modulation. As it can be judged by its name, this modulation technique varies the phase of a carrier wave in order to perform the data. In other words, to encode the signal, we need to give the values of the angle at which the phase of the wave has to be changed.
In contrast to the previously described FM technique, PM is not associated with the radio waves, as far as it demands special hardware to be installed at the receiving point. This modulation scheme is more often used with digital technologies aimed at reproducing the sounds, such as voice recorders and music synthesizers [44].
SM
Among the other parameters which can be changed in a signal for its transmission is space. For this purpose, the space modulation, or SM is used. This modulation technique is associated with radio waves, just like frequency modulation. This type of modulation is of a rather external nature, as the information about signals is kept not within the modulator, but simply in the space. Consequently, what can be changed is the depth of modulation [7].
QAM
One of the methods of modulation which is being used in this thesis is 16-QAM. Interestingly, this technique can be considered as both an analog and a digital technique.
Quadrature amplitude modulation (QAM) is a popular modulation scheme which is being used in many modern technologies. It can be used for ether digital or analog signals, and in both cases the principle of work is quite similar. In first case, it applies the amplitude-shift keying digital modulation scheme in order to modify the amplitude of a pair of digital bit streams [8]. In the second case, QAM uses the amplitude modulation scheme for analog modulation in order to modulate a pair of analog message signals.
In order to derive the final waveform, the quadrature components (the operated pair of signals) need to be summed [45]. For digital modulation this sum will perform a combination of two kinds of keying, which are amplitude-shift and phase-shift keying. In case of analog modulation the sum of quadrature components will combine the two kinds of modulation, which are amplitude and phase modulation [46].
16-QAM is one of the elliptical QAM designs, which is usually considered first. This type of modulation is very beneficial because of the good error-rate performance and high data rate. In addition, the levels of noise and interference in 16-QAM are not higher than those of the other modulation schemes [8]. These advantages serve as the main reasons for which we decided to use this type of modulation in some of our experiments with transmission of compressed images over PLC.
16-QAM is most often used for radio links modulation. The principle of its work s based on changing a block of information into signals. The phase value of these signals is chosen from the range of sixteen calculated phase values; their amplitude is chosen four possible values. Next, the information flow is distributed by the modulator among two four-phase modulators. All in all, there are twelve angles in every phase of 16-QAM; what is more, these phases switch every time the bandwidth changes [44].
16-QAM is widely used in many modern applications, such as digital terrestrial television and the data transmission in third-generation mobile communications.
Digital modulation
The task of digital modulation, like that of analog modulation, is to convert the signals for their successful transmission through some medium. The only difference is that the digital communication schemes deal with digital signals. Similarly to the analog modulation techniques, the digital modulation also deals with the phase, frequency and amplitude of the sinusoid of the information. Among the benefits of digital modulation schemes are efficient use of bandwidth and power and low bit-error-rate (BER) [7]. In addition, it needs no special equipment to be installed for signal receiving.
Digital modulation is beneficial in comparison with other modulation methods, as the previously used techniques are not capable of dealing with digital services. What is more, the digital modulation techniques provide more qualitative and secure services [44]. In addition, they are less time-consuming. All in all, the accepting of the digital modulation schemes is necessary in today’s world of competitive technologies.
Among the techniques for digital modulation are PSK, ASK, FSK, MSK, PSM, and others [46]. We will give the brief description of the schemes and pay a special attention to OFDM, as it is a basic modulation scheme used in our thesis.
PSK
Another modulation scheme that can be mentioned in his set is PSK, or phase-shift keying. Similarly to the previously described analog PM scheme, PSK is aimed at changing the signal’s phase. Thus, the PSK is designed to operate the phases, which encode bits. Every phase represents a symbol, which is formed by the type of signal encoded by this phase. The number of phases for PSK is theoretically unlimited; however, the practical results suggest that the number of phases should not be over 8. In other case, the error rate becomes unacceptably high [45]. As a result, for a greater number of phases, QAM modulation is more suitable. There are a number of PSK forms, such as BPSK, DPSK, QPSK, and others. PSK is not often used with high signal rates, as far as it cannot distinguish the signals properly.
In comparison with the mentioned QAM system, PSK is very simple, which makes it popular for modern technologies, especially in the sphere of commercial data transmission operations [7]. However, one of the disadvantages of the scheme is the fact that the demodulation of PSK signals can be rather complicated; that is why it is used only when there is proper equipment.
ASK
One more scheme which can be introduced for the comparison is ASK, or amplitude-shift keying. Similarly to PAM, it deals with the carrier wave’s amplitude. The principles of their work are also similar, however there are some differences. For instance, the ASK codes the signals as 1 or 0 depending on the level of amplitude [44]. As a rule, the 0 code is given to the signals with no carrier.
The scheme has a lot of advantages, such as simplicity of the system and cheapness of the modulation and demodulation processes. However, because of the similarity with the PAM in the system work principles, it also has some similar drawbacks, such as signal interference and high sensitivity to the noises [46].
FSK
FSK, or frequency-shift keying, is another technique for digital modulation. The principle of its work is based on changing the discrete values of the carrier’s frequency in order to transmit the digital data. This technique is similar to the one described in the section about the analog modulation. However, it is not often used because of the waste of bandwidth during the modulation process.
MSK
MSK or minimum shift keying is a wide-spread technique for digital modulation. To represent the information, it uses two frequencies. The phase of the carrier’s wave is changed in this technique. The binary one in MSK equals 90 degrees, and the binary zero equals -90 degrees [47].
Among the advantages of the technique are its capability to be synchronized automatically and the efficient use of the bandwidth. Therefore, it is often used for digital technologies.
PCM
PCM stands for pulse-code modulation. This type of modulation deals with analog signals, converting them into digital information. The information transmitted by the signal is sampled with definite intervals and is encoded. The world “pulse” in the technique’s name means the existence (1) or absence (0) of the pulse in the represented signal. Thus, the coded pulses represent the quantized wave [45].
PPM
One more technique for digital modulation is PPM, or pulse-position modulation. This method suggests representing the information by changing the position of the pulse regularly.
The disadvantage of the method is the risk of multipath interference. However, the technique also performs as a resistant object in the noisy environment [47].
OFDM
As it was mentioned before, OFDM is one of the methods of digital signal modulation. We will pay a special attention to this technique, as it was accepted as a basic modulation scheme in our thesis.
The frequency multiplexing modulation was designed several decades ago. However, the interest and the use of this technique in communication systems started relatively recently. With the rapid expand of wireless digital communications the demand for wireless systems that are reliable and have a high spectral efficiency has also increased. Not only the issue of limited spectrum, but also the increasing demand for bandwidth suggested that an innovation had to be introduced in the field of wireless communication. The new technology was required to have the following features [57]
- service for a greater number of consumers in individual cells;
- new technical possibilities for the users;
- greater data rate possible to transmit;
- higher spectral efficiency;
- lower cost of the carrier for traffic transportation;
- accessibility to the consumers.
The scientists in the field of engineering have been developing the existing technologies for years in order to achieve the desired results. They investigated different issues such as air interface design, hardware improvement, aerial technologies, radio frequencies etc. However, the next-generation technology for wireless communication appeared in a conceptually different sphere [57].
Frequency division multiplexing (FDM) is one of the most promising techniques modulation and transmission of multiple signals through a transmission path, such as a wireless system or a cable. The frequency carrier varies in different signals, and depends on the sort of data which is being transmitted. The orthogonal frequency division multiplexing (OFDM) is different from the other schemes because of using many sub-carriers for signal carrying [26].
Following is the schematic and mathematical explanation of the system organization.
System organization
The Orthogonal FDM (OFDM), which can also be called multi-carrier or discrete multi-tone modulation, functions in a slightly different way comparing to the FDM. It is a very efficient type of parallel transmission scheme. Its work is based on the following algorithm [26]:
- The inverse fast fourier transform (IFFT) takes the signal from time domain to the frequency domain and back. No loss of information is observed at this stage.
- Than the OFDM signals are formed. They are aimed at distributing a high-rate data stream among different carriers, which are tuned to have individual frequencies.
The most significant feature of the carriers is the fact that they are separated at the receiver. Such division suggests that the demodulators can only detect their own frequencies; otherwise the signals would interfere and distort the initial data. This means increase in the efficient use of the limited bandwidth. Where the FDM divides a channel into many non-overlapping subchannels to transmit information, OFDM makes use of the available bandwidth by allowing these subchannels to overlap by modulating the information on orthogonal carriers that can easily be discriminated at the receiver [6, 51,]. Such scheme makes the design of both the transmitter and the receiver plainer, eliminating the need of a filter for each subchannel.
One of the OFDM peculiarities is that it demands that the frequencies of the receiver and the transmitter were synchronized accurately. In case the frequency fluctuates, there is a great risk of inter-carrier interference (ICI) between the sub-carriers.
The separate spacing of carriers gives the OFDM such advantages as:
- having a high spectral efficiency
- being resistible to RF interference
- being less affected by multi-path distortion
In addition, the orthogonality also provides a high spectral efficiency, which is required nowadays in communication technologies. It allows using practically the whole frequency band. OFDM spectrum is usually almost white, which enables the system to interference in the electromagnetic field with respect to the other users of the channel [51].
This system is very beneficial in comparison with traditional single-carrier schemes, as far as it is capable of overcoming the severe channel conditions. Namely, OFDM is capable of mitigating the attenuation of high frequencies in a long copper wire, frequency-selective fading, and narrowband interference. OFDM does not need any equalizing filters, as far as it uses many low-rate narrowband signals instead of one high rate wideband signal.
The interval between symbols in OFDM is safe. Their low rate is very beneficial, as it prevents the system from the intersymbol interference (ISI). The single-frequency networks can also be improved by this technique, as far as signals from different transmitters can be combined. In contrast, a conventional single-carrier system suggests that the symbols interfere with each other [51]. Thus, one of the main principles of OFDM functioning is to transmit a number of slowly modulated streams instead of a single rapidly modulated stream.
Another OFDM feature is that it is always used in combination with channel coding. In addition, this system uses frequency and time interleaving to correct the errors. These techniques are applied in the system in order to divide the errors among the bit-streams delivered to the error correction decoder. Otherwise, if there was a number of errors presented, the decoder would not be capable of correcting them all [26].
OFDM also allows the application of maximum decoding with reasonable complexity, as far as it is computationally efficient by using FFT algorithms to perform the modulation and demodulation functions [46].
The orthogonailty of the carriers is vital to generate OFDM successfully. The only way to achieve this is to constantly control the interaction among carriers. That is why, at the very beginning of OFDM work it is very nesessory to choose the appropriate spectrum based on the input data and modulation scheme. Next, the required amplitude and phase of the carrier is calculated with the help of the computed scheme. Later the system converts the required spectrum back to the time domain signal with the help of Inverse Fourier Transform (IFT). In such operations an Inverse Fast Fourier Transform (IFFT) is used most often. The converted spectrum includes the amplitude and phase of each component.
An IFFT is capable of converting a number of complex data points into the time domain signal with the same number of data points [36]. IFFT transforms the spectrum very efficiently, and lets checking whether the signals are orthogonal easily.
While working with OFDM signals, it is important to generate the orthogonal carriers for them. Setting the amplitude and phase of each bin (data point in frequency spectrum) and performing the IFFT will allow doing this. Each IFFT bin corresponds to the amplitude and phase of a set of orthogonal sinusoids. Therefore, the orthogonality of the carriers is provided by the reverse process [36].
OFDM use
Because of its advantages, such as robustness to multipath and frequency selective fading mentioned before, OFDM is now widely used for wideband digital communication, both wireless and over wires. is often applied in modern technologies, for example in digital TV, digital audio broadcasting, wireless networking, Wj-max, and broadband Internet access. Its popularity is increasing, and so do the expectations for its future possibilities.
OFDM is expected to achieve a wireless broadband multimedia communication that provides data rates of 100 Mbs and above [58]. In other words, this technique of data transmission is ten times faster and cheaper than the popular 3G, which being widely used in the world today. Therefore, OFDM is becoming the main candidate for the next generation mobile communication systems.
Basically, OFDM is applied as a digital modulation technique as far as it is designed for transmitting one bit stream over one communication channel with a single order of OFDM symbols. However, OFDM can also be used as a multi-user channel access technique which is capable of separating the users according to frequency, time, or coding [36].
OFDM is often used in ADSL connections using the copper wires in order to achieve high-speed data connections. This is due to the fact that it is capable of preventing the attenuation of long copper wires at high frequencies [39].
Another popular way of OFDM application is its usage in powerline devices aimed at extension of the Ethernet connections to different rooms in a building. This process is realized with the help of its power wiring; therefore, the adaptive modulation is required in order to prevent the possible noises.
The other uses of OFDM are in the sphere of wireless personal area networks and terrestrial digital radio and television broadcasting. OFDM is also now being used in some wireless LAN and MAN applications [58].
However, the implementation of some OFDM technologies in real life is not realized fully. For instance, the OFDM-MIMO networks face some difficulties with being utilized in modern applications. Although their implementation can be very beneficial, it is restricted due to the need of the equipment for this technology [36].
Disadvantages
OFDM is expected to achieve high data rates of more than 100/20 Mbps for fixed/moving receiver [48]. However, there are some disadvantages of this method, which should be taken into consideration. For instance, the large peak-to-average power ratio is a negative phenomenon for the data quality. Therefore, choosing an appropriate compression method is of a vital importance.
The typical reason for frequency failures is the false choice of transmitter and receiver oscillators. The failures also may be caused by Doppler shift because of the movement, which can be corrected by the receiver [39]. The hardest to correct are those errors when the Doppler shift is combined with multipath. In this case, the reflections occur at various frequencies, which limit the application of OFDM in high-speed vehicles.
Another disadvantage of the system is that OFDM signal has very dynamic noise amplitude [57]. This feature points to the need of RF amplifiers with the power ratio of the highest to medium power ratio.
In addition, due to the insufficient use of DFT, OFDM is more sensitive to carrier frequency fluctuations than the traditional single carrier systems.
PLC
Power line communication (PLC) is a system which is a basic point for the research and experiments of the current thesis. This system has many different names; it can be met in different sources under such names as power line digital subscriber line (PDSL) or power line carrier (PLC). PLC can also be called power line networking (PLN), mains communication, or power line telecom (PLT) [40]. It can be generally defined as a system which is used for data transmission at narrow or broad band speeds through power lines.
It is usually used in buildings, houses, factories, etc. PLC systems are now being developed as an alternative to conventional wireless and hard-wired communication systems, because of being cheaper and more convenient. While six decades ago PLC were only able to work with a frequency of 10 kHz and were used for town lightening, now they can be used for getting an access to Internet. This is very rational, as far as PLC does not need any additional wires in order to organize the communication, which suggests simplicity of installation [11].
The modern technologies for personal usage such as PCs are required to have wireless IP ubiquity and also to be able to provide “multiplay” services among which is the irreplaceable Internet. Thus, wireless technologies are becoming more and more popular; the only question remained is how to provide the required services with the help of power-line communications.
The traditional Wi-Fi technologies proved to be simple and stable, but their security level is not high enough. PLC managed to reach the bit rates required and also to prevent the problem of system insecurity. For instance, the modern Home plug 1.0 can reach the speed of 14 Mbits/s, Home plug 1.1 supports the rate of 85 Mbit/s, and HomePlug AV enables reaching to the point of 200 Mbit/s [11]. These rates, however, on practice are less, as their physical layer does not include the customer’s operations, such as file exchange, web browsing etc. In addition, the electrical network serves as a shared medium for the connected devices and can be treated as an Ethernet hub. Thus, the operated data is to be shared among all the devices in the network [11].
Power Line Communications were invented relatively long ago. However, the wide application of PLC techniques started more recently. The increasing popularity of so-called “smart houses” and car automation suggest using PLC of different bit rates; moreover, many engineering companies set PLC chips in different devices in order to make it easier for them to network after installation. In addition, PLC interfaces are often integrated in different electronic products with the purpose of their further connection over an existing network of cables [11].
The increasing need of high-speed Broadband data services caused a further development of PLC. Its most popular form is Broadband over Power Lines (BPL), which is basically used for Internet access and is aimed at dealing with high speed data services. BPL speed is greater than 256Kbps, which makes it beneficial in comparison with traditional systems [9].
Despite the dynamic development and wide use of PLC, its standardization is still doubtful. Undoubtedly, this technology should be standardized on the international level. Such technological consortiums as HomePlug, OPERA, and CEPCA are being considered as the most suitable for the system’s support; however, they still compete for the leadership in IEEE [35].
PLC is becoming an extremely important technology today due to the Ethernet link required in ISPs. PLC is capable of delivering a stable high bit rate stream safely, and this feature meets the modern requirements for communications. Moreover, PLC performs a better delivery quality than any of the existing Wi-Fi standards [5]. PLC can be treated as a relatively reliable technology, for its frames have the chip security and are additionally encrypted with a network key.
PLC chipsets also came in demand after some OEMs offered by different companies started to produce various starter kits with several data streams.
System work
The basic scheme of PLC work can be explained as data transmission with the help of power distribution lines. It delivers the electric current to the users in the form of low-frequency (50 – 60 MHz) alternating current. In this process high frequency carriers are used for data transportation. the used band can vary from 1 MHz to 34 MHz [13]. PLC is applied in the last two electrical network sectors, those of low and medium voltage.
As it was mentioned before, PLC uses OFDM coding for data transmission. This modulation scheme prevents the interferences in power networks most effectively; in addition, OFDM provides the high level spectral performance and efficiency [5].
The primary task of a distribution network is to interconnect a number of users. In PLC, the distribution network interconnects the head ends which service the low voltage networks. The PLC network access is deployed by using low voltage wiring, which covers the distance between the transformer located in the distribution substation and the socket outlet in the customer’s home. However, the low voltage transformers demand fiber to be deployed, which is rather costly. PLC offers a solution for this issue, which is the medium voltage network. It is used for data transmission in areas where the installation of low voltage networks is not profitable. Therefore, PLC can be considered as a great alternative to the current metropolitan rings [40].
The scheme of PLC work can be explained in the following way [40].
An average PLC system has two basic elements, which are:
- a transmitter unit aimed at transferring the communication signal to the power line signal
- a receiver unit which separates the communication signal from the power line signal.
The modulated RF carrier signals are coupled by an appropriate network to the power distribution system. These signals are generated by a transmitter in one locaton; at the same time, a receiver located in other place receives and demodulates the RF carrier. Such synchronic work enables the data signals to be transmitted through different locations.
A high frequency signal is obtained in the condition of low energy level for the electrical signal with the frequency of 50 Hz. This signal is transmitted with the power system, and is then decoded at the receiver’s side. Therefore, the PLC signal can be received by any PLC receiver which is situated in the same electrical network, which makes it very convenient for the domestic or office use. The specific feature about a PLC receiver is the presence of a special integrated coupler at the entry, which is aimed at blocking the low frequency components before processing the signal [12].
The electrical power is transmitted by the high voltage transmission lines and later is distributed over medium voltage. Then this power can be used for indoors applications at lower voltages. The PLC can be used at every stage of the process. The majority of PLC technologies can only operate with one set of wires, but there are some which can be involved in two levels [47].
The work of PLC is based on sending a modulated carrier signal to the wiring system. At the same time, the frequency bands which are used by a particular PLC are highly dependent on the signal transmission characteristics of a particular power wiring. However, the power wire circuits have some limitations in respect of carrying higher frequencies. Therefore, different types of PLC have different limits.
The volume of data transmitted over a PLC system can vary according to the channel type. Carriers of low frequency (which is about 100-200 kHz) impressed on high-voltage transmission lines are able to carry one or two analog voice circuits [11]. They allow controlling the circuits which have a few hundred bits per second equivalent data rate. The only possible problem here is that these circuits can be rather long. The general tendency is: the higher data rates are, the shorter ranges are implied. Therefore, a network can only cover one floor of an office building. It also excludes the possibility of dedicated network cabling installation.
PLC system can be implemented when a PLC modem is installed. A PLC modem is a device which helps to use the traditional power lines as a communication line. Such modem work is based on converting digital data from the unit which deals with information operation to analog line data, and then converts the last to digital signals. These signals are then transferred back to the information operating unit. PLC modems can be applied in different ways, one of which is interaction between computers or different devices with no special cables. Considering all the opportunities mentioned above, a PLC system enables separate communication stations unite into a single network [55].
Broadband over power lines (BPL) is becoming very popular nowadays. The principle of its work is based on modulating the carriers with the information at radio frequencies. Then, the radio frequency energy is delivered to the power line media. In this way, BPL achieves the high data rates. In addition, BPL uses the metallic power line conductors and their conduction in order to carry the modulated data signals from the sending modem to the receiving modem [9]. Moreover, BPL works independently from the radiation of radio frequency energy.
The BPL networks are usually installed on two medium voltage lines. BPL can also be used with other purposes apart from the Internet access. For example, it also allows exploiting modems in order to provide in-house LAN capabilities in competition to Wi-Fi. The use of PLC technology appears to be very beneficial for the broadband signaling, as far as the power lines are installed in areas where the information transmission and safe delivery is possible [9]. BPL is also expected to have a much greater number of fields it can be applied in; specifically, the technology is predicted to be used in information kiosks, traffic lights, metering systems and many other applications.
BPL technology is a real breakthrough in the world of engineering. It can offer the bandwidth capability comparable to that of ADSL. BPL is proved to have a potential of working with streams of speeds from 256kbit/s to 2.7Mbit/s [9]. Such rate is achieved with the help of the medium and shortwave spectrum for data encoding. BPL modems are connected to the head-end which is located at the substation. There, a fibre or a radio can be exploited with the purpose of connecting back to the central office. BPL uses an isolation capacitor in order to insert the modulated radio frequency carrier into the local electricity distribution network. This allows the transmitter to have a power of hundreds of watts [9].
In general, power lines cannot serve as an efficient media for radio frequency energy transmission. There are different reasons why PLC is unsuitable for this role, but the most important from the customer’s pont of view is its incapability of carrying the radiocommunications energy, which causes interferences with different radiocommunications services in case of leakage. The solution for this problem was developed by the current BPL technologies. Their signals are different from other forms of radio frequency radiation, because of the use of the HF and VHF radio spectrums [11]. Therefore, BPL signals are wideband, and the risk of interference is reduced.
Application of PLC
PLC can offer a multitude of opportunities, such as Internet communication on with a speed higher than ever before, home networking system, Internet phone, home automation, and remote metering systems. All this things are possible simply with connecting a computer plug to a power source; no cables or telephones are needed [55].
The advantages of PLC in comparison with the traditional power systems are obvious. Specifically, the usual power distribution system aimed at an indoors use consists of wires, fuses, switches and controls, electric outlet receptacles, and also different appliances which operate the low frequency AC power. In contrast, the PLC system transmits a radio frequency signal of a few hundreds Hz to a few tens MHz together with and fluctuating power to a power line. This provides a supply of the fluctuating power with frequencies of 50 to 60 Hz to houses [11]. In addition, a separate device is prevented from interference with other communication signals.
The use of PLC in different fields depends on the frequency level. For instance, large portions of the radio spectrum can be used by high frequency communication; it can also apply PLC as a connection between personal computers or peripherals. The high frequency communication also uses PLC for broadband over powerlines, which is access to Internet [55].
On the medium frequency level PLC technology also has its applications. For instance, it can use the household electrical power wiring as a transmission medium. For instance, it is widely applied in remote control for home automation [5].
Concerning the low frequency level, PLC can exploit it to work with the automatic meter reading systems. It allows collecting the new data from all the metered points and therefore provides the better system control. Thus, PLC can be used for multiple purposes, such as energy distribution and safety control in applications such houses, factories, offices, and vehicles.
Another opportunity which PLC gives is a network communication of various signals in a vehicle. This is possible due to the digital impulses over direct current battery power-line. A small device made of silicon contains the digital communication techniques which are aimed at overcoming different disturbances, such as noise. Moreover, one PLC can control a number of separate networks by connecting each of them to a receptacle. This system is preferred because of different advantages, such as cheapness, lower weight in comparison with control wirings, simplicity of installation and application [5]. However, using this system in a vehicle can also have some disadvantages, such as high risk of interference with signals of different frequency and probable high price of the end devices which have to be installed [11].
PLC Broadband technology is able to transmit data with the network of an electrical supply. This enables to extend a local network and even to provide the connection to Internet through ordinary electric plugs. Moreover, the scientists predict PLC to make a super high-speed Internet accessible. To make this work, special units are to be installed.
PLC failure scenarios
The convenience and low cost of PLC made it very popular among communication systems. However, despite the fact that the PLC has a number of advantages which make it perfect for communication, there are some negative points about it. For instance, the distribution power lines are sensitive to different kinds of electric interference, such as Gaussian white and colored noise and voltage spikes. In addition, when a PLC is being used, the RF interference should be eliminated. Namely, if the equipment connected to the home power line, it can produce noise or reduce the resistance of the power line. This can increase the error level and cause communication failures in the PLC.
Moreover, the power lines weaken the RF signals; they also are not able to transfer the signals of higher frequency efficiently. As a rule, PLC uses normal mode signals. Thus, communication failures may be caused by the normal mode noises which are produced by the electrical devices. If a load is of an insufficient channel property, there can be considerable distortions caused in the PLC channel; this means a fundamental decrease in communication quality [11].
There are different sources of communication signal error. The particular active and passive devices and such phenomenon as interference can weaken the signal or cause noise. This can lead to uncontrolled or inefficient functioning of the devices to which the signals are being transmitted.
For instance, the interference with systems which are placed in the nearest area can cause signal degradation. This is due to the inability of a modem to distinguish a signal of a particular frequency among a number of other signals in the same bandwidth.
The active devices such as transistors, relays or rectifiers generate noise in their systems. This leads to signal attenuation in power line communications. The other hazardous objects are passive devices, namely transformers and different converters, which attenuate the signal even more considerably [12].
The other problem is BPL interference, which is very dangerous for the radiocommunications users. BPL transmissions cover the shortwave spectrum with the power of up to hundreds of watts. The cables of lossy distribution function like a traditional aerial; that is why the wideband BPL signal has a powerful radiation over a great area. This radiation causes a considerable interference, which became a real problem. Even the devices for regulation such as OFCOM or FCC are treated to be not effective enough to prevent the interference [9].
Of course there are various techniques which are being developed to decrease the signal interference, improve the PLC performance, and prevent the possible distortion of transmitted data. Some of these techniques will be described later in this thesis.
Error correction
From the description of the PLC and OFDM systems, it is clear that the performance of every communication system is at risk of being degraded by different errors. That is why it is important to study the ways of error liquidation and correction while working with signal processing.
The most popular way of error correction in communication systems is implementation of error-correcting codes. In general, they can be explained as data which is added to the message before it is sent. Error correction codes can be applied in many technologies; they are perfect for data storage for computer, digital communication channels and broadcasting. This is due to the fact that they only demand a one-way channel, as far as they have no need to move from the receiver to the sender point.
The error correction codes can be divided into two main groups [42]:
- convolutional codes
- block codes
The first group of codes is bsed on the bit-by-bit principle of processing. The second group uses the block-by-block principle.
The second group, which is block codes, is used in all the modern technologes. The BCH codes, which will be implemented and observed later in this thesis, also belong to the group of block codes.
The measure for the effectiveness of a particular coding scheme is k/n, where k is for information bits, and n is for transmitted data bits [41].
One of the most popular techniques for error corrections in different spheres including the communication systems is the Reed-Solomon code. This code is block-based and it found use in many modern applications, such as storage devices, different modems, satellite and wireless communications, digital broadcasting etc.
The principle of Reed-Solomon encoder can be explained in the following way. It takes a block of digital data and adds extra bits to it in order to correct the errors which occur in communication systems during the data transmission or storage. It works with every block individually, which guarantees the high efficiency of the technique [37].
In this thesis, the special attention is paid to the BCH codes. They belong to the group of Reed-Solomon codes and are referred to as parameterized error-correcting codes. BCH codes are applied for multiple random error patterns correction.
These codes are very beneficial for error correction due to the simplicity of use. The electronic hardware for the BCH encoding is easy to build and implement. These codes also have the advantage of a flexible structure, which allows regulating the block size and error thresholds [41].
However, in real life condition errors seldom occur randomly. In most cases, error bursts are observed in communication systems. This phenomenon can be corrected afterwards with the means of message bits interleaving. Error bursts mean damaging a number of bits in a row; that is why a traditional error correction scheme is not capable of handling all the errors at a time. Interleaving is the only technique which can be applied in this case.
The transmission of data is often realized with the error control bits. This enables the systematic correction of a certain quantity of errors which occur during the process of transmission at the receiver side. As it was mentioned before, the correction of errors is impossible in case of error bursts. The solution of this problem is offered by the interleaving technique. It interleaves the bits of several code words before their transmission in order to correct the effect of the possible error burst. In this case, only a certain number of bits in each code word can be affected by the error burst. These bits can be simply corrected later. This enables the decoder to decode the code words correctly [41].
The interleaving technique is widely used due to the cheapness and simplicity of this operation comparing to the direct increasing of the error correction scheme power increase. Among the negative effects of interleaving implementation is the consequent increase of latency in the system.
Summary
In this chapter OFDM and PLC systems for data transmission are introduced. OFDM is a particular form of multi-carrier transmission method and is designed for working in frequency selective channels and with high data rates. This technique reconstructs a frequency-selective wideband channel into a group of non-selective narrowband channels. The orthogonality in the frequency domain makes it robust against large delay spreads.
In addition, the use of cyclic redundancy at the transmitter reduces the system complexity to only the FFT processing and taps scalar equalization at the receiver. OFDM is a very promising technique due to its orthogonality; however, it has some drawbacks such as frequency failures and dynamic noise amplitude. We also briefly analyzed the other modulation schemes, comparing the principles of their work and peculiarities. Specifically, we focused on QAM, PSK, and PAM modulation schemes.
PLC is a system for carrying data and transmission of electric power. It has a number of advantages, such as simplicity in use, multifunction and comparative cheapness. Power line channels need advanced signal processing techniques in order to be able to provide the successful communications. In addition, the question of the technology standardization is still open. For speeds lower than 85 Mbps there exist some standards in USA; however, there are still no standards for PLC adopted in Europe. For PLC better performance, the noise level has to be reduced.
PLC is able to work with different voltages and frequencies, which makes PLC very convenient. BPL is also a widely used technique which offers a number of services. However, there are also some drawbacks, such as communication signal errors and predisposition to interference. These issues are to be corrected with some additional techniques.
There are many error-correcting techniques used for communication systems. The Red-Solomon encoding and decoding algorithm proved to be efficient. Its error correction capability makes it one of the most widely used error correction codes in the industry. The special attention is also paid to the BCH codes, which are simple in use and efficient for error correction.
Methods of data compression
With the growth of digital technology use, different operations with multimedia are required. Various data, sounds, and images need to be transmitted or stored. This means that the energy, bandwidth and digital space are demanded. In order to save the mentioned resources, the operated data needs to be reduced somehow. With this purpose, data compression is used in digital technologies.
Compression is an important process which is widely used nowadays in digital technologies. It is aimed at economizing the digital space and connection bandwidth [23].
Data compression can be explained as the process of encoding information with the help of some information units [20]. The only necessary condition for this process is the ability of both the sender and receiver of the data to recognize and operate the encoding model. The design of this model includes the level of compression and distortion, and the needed computational resources for the operation [20 ].
Data compression is widely used nowadays; its application is irreplaceable while working with file transmission. As it was mentioned before, the images presented on the web are usually compressed in the JPEG or GIF formats; compression is also used in modems and for stored files in most systems [21]. Compression is generally aimed at reducing the file size and therefore at economizing the electronic space.
The process of data compression, however, might be inconvenient in some respects, as it involves algorithms which include sorting, hash tables, tries, and FFTs [36]. What is more, the used algorithms need a strong theoretical basis.
The general scheme of compression process has two basic elements, which are encoding and decoding. Encoding algorithm operates the file and reduces its bits and represents it in a compressed form; and the decoding algorithm reconstructs the original file from the compressed representation [36]. Encoding and decoding processes have to be agreed in order to work with a file efficiently.
There are two basic algorithms for image compression, namely lossy and lossless algorithms. Lossless algorithms allow reproducing the compressed file maximally close to its original form. In contrast, lossy algorithms are only able to reconstruct the general model of the original message [9]. The difference of effect explains the usage of the techniques in different spheres. For instance, lossless algorithms are usually applied for text and other data which need the exact information to be preserved. Lossy algorithms are used for compression of images and sound, when the quality is not affected seriously by the loss of resolution [48]. The word “lossy” does not necessarily mean loss of quality or pixels for an image; this word stands for loss of some quantity feature, for example noise or frequency component.
Surprisingly, the process of compression is often based on probability. It is due to the fact that not all types of files can be compressed. Therefore, there must be an assumption about what inputs are more possible to occur [9]. For example, the structure of the message can be analyzed from point of view of probability: white areas are typical for all sorts of images, and the chance of their occurrence is pretty high. Another assumption can concern patterns in texts or objects, which are often repeated with a specific tendency rather than built individually. Thus, compression algorithms have to include the calculations of probability.
An important feature which should be discussed while talking about compression algorithms is the existence of two components; specifically, the model and the coder components [49]. The model component deals with the probability mentioned before. It analyzes the structure of the input and defines the probability distribution of the file. The coder component is aimed at generating codes according to the results presented by the model component. In fact, the coder component balances the files, enlarging those which have low probability and reducing those with high probability. The model component of any compression algorithm can be designed and programmed in various ways and on different levels of difficulty, depending on the operated data. The coder component, however, is rather limited in this respect; it is usually based either on Huffman or arithmetic codes [31].
The model and coder elements are connected by the information theory of particular data. This theory allows predicting the interdependence of the probability, file content, and code length.
This thesis deals mostly with image compression. Therefore, it is important to highlight the clear distinction between the compression of an image and binary data. Consequently, not every compression technique is suitable for working with images, as they demand a minimal loss of quality. Images have some specific statistical properties and therefore need encoders with a certain design them. Of course lossless compression algorithms are most suitable for images; however, lossy compression techniques can also be used [49]. They are mainly applied in cases when storage space or bandwidth need to be saved, and some image details can be lost.
This chapter is devoted to different algorithms for data image compression.
Lossy compression algorithms
As it was mentioned earlier in this chapter, lossy compression is a compression algorithm in which the original file loses some of its properties. Lossy data compression is sometimes called perceptual coding [31]. It is usually applied in cases when the loss of data quality to some extinct is permitted. Lossy data compression is aimed at assessing the best fidelity for a particular amount of compression.
When a lossy compression is applied, the exact data is impossible to be reconstructed from the compressed information. However, this does not mean an unavoidable loss of quality; in some cases the difference between the original file and the one which was compressed with a lossy algorithm is unnoticeable (for example, loss of ultra frequencies). Sometimes loss of specific features can even improve the quality, as in case of removing the noise from an image. That is why lossy compression algorithms can perform better than lossless when working with images. As an example, while working with JPEG image files, one can control the amount of loss and the level of quality. However, the type of lossy compression algorithm should be chosen according to the specific features of a compressed file, for the quality should not be degraded to distortion [49].
Lossy compression is implemented in a number of fields. It serves as a basis for popular JPEG and MPEG standards; it is also used in combination with lossless compression algorithms in such techniques as PAQ, DEFLATE, etc [48].
Among the algorithms for lossy data compression are wavelets, vector quantization, linear predictive coding, discrete cosine transform, fractal compression etc. The methods of lossy data compression which are being studied in this thesis are DCT, DWT and BTC.
Transforms
First of all, before explaining the principles of transforms’ work, it is worth clarifying what transforms are and what are they needed for. The various signals are often transformed mathematically in order to derive the information which cannot be simply read in the raw signal. In other words, a processed signal can be much stronger and informative than the raw one.
In signal processing, a multitude of transformation types can be used. The Fourier transforms (FT) are treated to be traditional and are the most popular in the particular field. They are used in many fields including engineering. FT is a reversible transform, which means that it allows operating both with the raw and transformed signals [52].
It is worth mentioning that almost all the raw signals are time-domain signals [32]. It means that the signal will be always involved in the time function: in signal representation, the independent variable is time, and the dependent variable is most often amplitude. Such representation is not always advanced for signal processing, as far as the frequency component is not considered in this case. The frequency components form the signal’s frequency spectrum, which usually contains the significant information about the signal.
In other words, the frequency domain often contains the data which cannot be read in time domain. The measure for frequency is Herz, which is quantity of cycles per second [32].
Despite the fact that Fourier transform is one of the most often used for electrical engineering, there are many other kinds of transforms. Every transformation algorithm has its advantages and disadvantages and id applied in different spheres. The transforms which deserve a special attention are wavelet transforms.
As it was mentioned before, Fourier transform allows operating both with the raw and transformed signals. However, it gives no opportunity of working with them at the same time. In other words, at a particular point of time only one of the signals is available. In some applications, for example while working with non-stationary signals, these opportunities offered by FT are just not enough for successful operations.
In contrast, the wavelet transform allows getting both the time and frequency information simultaneously. The principle of wavelet transform work is completely different. It divides the signal according to its frequencies [29]. Here a certain rule works, which says that the resolution of higher frequencies can be bestly obtained in time; and the lower frequencies are better resolved in frequency. Thus, WT distributes the frequencies correspondently among the time and frequency components.
Following is a more detailed explanation of wavelet work.
Discrete Wavelet Transforms (DWT)
Wavelets are widely used in signal processing for the decomposition of signals and images prior to the implementation of a compression algorithm. The basic premise of wavelet transformations is that they give an opportunity of decomposition of any given signal into many functions.
In general wavelets allow working with different functions of one or more variables. One of their advantages is a stable localization, which s very important when representing the various functions. The obligatory condition in wavelets is the compact support of each element in time and frequency domains. In addition, the computation is realized with the help of fast algorithms [29].
In fact, wavelets characterize a signal in terms of some underlying generator. Thus, wavelet transformation is being applied in different fields beside compression. As an example, wavelet transformation also is used in order to remove noise from data. It also is applied in operations with medical images, analyzing the X-rays, and in computer vision [32].
The discrete wavelet transform (DWT) is being used in a number of applications. Its ability to realize the nonstationary processes in an adequate way is very valuable in the field of digital technology. The technique which was most popular in the field previously is fourier transform (FT). In case of working with a stationary process this algorithm is perfect, as far as it keeps the coefficients of decomposition separately. However, this feature might also be treated as negative, as these coefficients place chaotically in time domain in case of running the nonstationary process. Consequently, the computation of the decomposition algorithm is very complicated.
In this respect, DWT shows a better performance. Its design allows dividing the process into parts in frequency domain while localizing them in time domain. This enables DWT to perform better than FFT, as the representation that is held both in frequency and in time domains [31].
Discrete cosine transform (DCT)
A discrete cosine transform (DCT) is used mostly for lossy images compression. It is a specific method which suggests compression of mostly real-life data. Introduced in 1974, DCT is applied in such spheres as filtering, image and speech coding, pattern recognition, etc. It can be used in JPEG, where DCT2 of blocks are computed and the results are quantized. There are eight standard variants of DCT, and four of them are considered to be common. In this study we use the one-dimensional (DCT1) and 2-dimensional (DCT2) transforms. The last one is the most commonly used form due to its computational convenience. The various versions of the DCT differ not only in the mathematics, but also in performance [50].
The principle of the discrete cosine transform work is based on dividing the image into parts according to different quality level: the parts which are less important are likely to lose the quality. The technical task of DCT is to transform the file from the spatial domain to the frequency domain. The coefficient for the output image (B) can be derived from a formula:
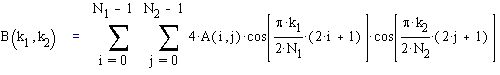
where A is an input image; N2 is the input image; A(i,j) is the intensity of the pixel in row i and column j; B(k1,k2) is the DCT coefficient in row k1 and column k2 of the DCT matrix [50]. Computation of DCT is rather convenient in comparison with other transforms, as there is no need is numerous multiplications as far as all DCT multiplications are real.
DCT can be considered as a very beneficial algorithm for a set of reasons. One of them is its ability to accumulate and preserve energy; only few components use the signal energy. This ability is called “energy compaction property” [50]. This feature is extremely important while working with images, which have their energy concentrated in the low to middle frequencies. Since the human eye is more sensitive to the middle frequencies, DCT significantly reduces the amount of energy needed.
While the popular Fourier transform uses both the sine and cosine waves to represent a signal, the DCT uses only the cosine waves. The discrete cosine transform compression result depends on the sort of processed data, which makes it a bit complicated. However the compression ratio performed is always satisfactory.
The peculiarity of DCT is its synchronism; it suggests that a 8×8 pixel group results in an 8×8 spectrum, and the quantity N of any numbers will be changed into the same N quantity. DCT requires no complex mathematics; all the values are real. In DCT, the amplitude of every basis function represents a value in the spectrum.
In order to calculate the DCT spectrum, the 8×8 pixel group needs to be correlated with every basis function, whch includes several operations. In other words, at first you need to multiply the 8×8 pixel group by an appropriate basis function. The next step is to derive the sum of the products in order to find each spectral value. Next, to find the complete value of DCT, two more adjustments are needed to be done [51]. First, the fifteen spectral values have to be divided in column zero and row zero by two. Second, all the sixty four spectrum values have to be divided by sixteen.
The calculation of the inverse DCT can be made by assigning each of the amplitudes in the spectrum to the proper basis function. After that, the rusults have to be summed up to recreate the spatial domain.
DCT is often compared to the Fourier transform. This is due to their similarity in structure, principles of work and analysis. However, the performance of DCT for image compression proved to be better than that of the Fourier transform. This can be explained by the fact that DCT has one-half cycle basis functions, which can simply move from one side of the array to the other [52]. In contrast, the design of the Fourier transform suggests that the lowest frequencies form one complete cycle. Since all the images have areas where the brightness gradually changes, choosing an appropriate basis function which matches this basic pattern will reach better compression result.
Block Truncation Coding (BTC)
Block Truncation Coding (BTC) is a simple coding technique of lossy compression which is being widely used for grayscale images. Block truncation coding is sometimes also called a moment preserving quantizer. This technique for image compression was developed by scientists Delp and Mitchel. The structure of the system and principles of its work are rather simple. BTC is based on a two-level quantizer, which saves the moments of the input samples in order to obtain the output levels [18].
Basically, BTC segments the original images into blocks according to the different tones of the image. Thus, this procedure suggests forming several areas on the image, namely white, black and mixed (grey). After that the quantizer is used to reduce the number of grey levels in each block; at the same time it maintains the same mean and standard deviation as in the original image. As a result of such operation, the image becomes black and white only, and ix exposition and contrast values are much higher in comparison to the original one. The process does not last for too long, as the system does not work with every pixel.
Grouping the pixels which have similar values makes the process more quick and efficient. However, this method may not be appropriate for certain kinds of images where the semi-shadows need to be represented. One of the technique’s main advantages is the simplicity of computations, which do not take much time. Some scientists state that BTC performance can be compared with that of DTC’s, with the difference in hardware implementation simplicity [50].
As it was already noted, BTC divides the standard (256 x 256) image into several blocks of pixels (for example, 4 x 4 or 16 x 16). The bitmap is encoded in a way which suggests using one bit for one pixel; depending on the block size the ¼ and higher rate of compression can be achieved. The two levels of the output for every block are not correlated. Therefore, the process of encoding can be treated as a simple binarization. Thus, every pixel in the block is truncated to 1 or 0 binary representations depending on the output level [23]. The possible deviation is also encountered. In addition, to avoid the errors, the integers are suggested to be used.
Later this study with the help of BTC we will decompose an image into blocks of 2 x 2, 4 x 4, and 8 x 8, and compute the average pixel values of every image block. If the pixel value is greater than the average value of the image block, the pixel will be assigned as bit 1; if the pixel value is lower than the average value, the pixel is assigned as bit 0. After that we will compute the average pixel value of bit-1 pixels of the block to get a high-part average value of the block; we also will compute the average value of bit-0 pixels of the block to get a low-part average value of the block [24]. Replacing the pixel values of the gray-level image with bit 0 or bit 1 reduces the number of possible patterns of image blocks is from 25616 to 216.
Lossless compression algorithms
Lossless compression algorithms are designed in a way which allows preserving the exact qualities of the compressed data while performance. In other words, it is an efficient manipulation of the statistical redundancy of the data [48]. Lossless compression schemes are constructed in a way which suggests the original data to be exactly reconstructed after decompression; every single bit of information is preserved. It is widely applied for binary data, especially for compressing documents, software applications, databases, which need to preserve their exact linguistic and numeral information [19].
Lossless data compression is widely used for different purposes. Specifically, this method is applied in popular ZIP, GIF, and PNG file formats [53]. Interestingly, it is often combined with lossy data compression.
Lossless compression is most often used while working with artificial images such as technical drawings, medical images etc [48]. This is due to the fact that lossy compression methods perform compression artifacts. Thus, lossless compression is used when the maximal preserving of data is needed.
However, there are some types of data which lossless data compression algorithms are unable to compress, such as data which was already compressed at once.
Despite the fact that lossless compression is aimed at exact reproduction of the original data, it can be impossible with some files, such as images or audio files. Thus, the only possible way out in this case is presenting an approximation of an original file and assessment of the lowest possible error rate after compression [20].
There is a multitude of compression algorithms for lossless data compression. These are entropy encoding (including the popular arithmetic and Huffman coding), context mixing, run-length encoding, Lempel-Ziv coding, etc. They all have different principles of work. For example, a Huffman encoder reproduces a block of input characters of fixed length into a block of output characters of variable length. In contrast, the Lempel-Ziv algorithm does the reverse operation, transforming the characters of variable length into the characters of fixed length [22].
As any other systems, coding algorithms have their disadvantages. As an example, the Huffman Coding can be inconvenient as the statistics information needs to be agreed with the encoded stream of symbols. Thus, it is relevant to consider other algorithms for data compression [20].
Error measurement
A significant issue about compression algorithms is the question of their quality evaluation. The three main criteria which are considered when assessing the quality are runtime, the amount of compression and the quality of reconstruction [47]. However, their importance may vary according to a specific case. One of the most popular ways to evaluate and compare compression algorithms is defining the compressed image error [4].
There are two basic methods of evaluation of the error for the compressed image. These are the Mean Square Error (MSE) and the Peak Signal to Noise Ratio (PSNR). MSE enables to find a squared error between the original and compressed image; PSNR is applied when the peak error needs to be counted [4].
The general rule suggests that the lower value for MSE points to the lesser error rate. Its mathematical formula is:

where I(x,y) is the original image, I'(x,y) is the decompressed message and M,N are the dimensions of the images [47].
The value of PSNR is better when it is higher, as in this case it means that the signal is superior to the noise. Mathematically it can be expressed as:
PSNR = 20 * log10 (255 / sqrt(MSE)) (3)
Summary
In this chapter, the general information about data compression is given; its main types and algorithms are described. Data compression is a very important process which is applied for digital multimedia very often for their efficient storage and transmission. In order to preserve the quality of data, a proper compression method should be applied.
Images are generally compressed in order to minimize the number of bits. It allows avoiding problems which occur with the large-sized digital images and saves the electronic space. In addition, the demand for image transmission and storage suggest the application of data compression techniques in order to make these operations efficient. The coding techniques significantly reduce the number of bits and allow easy operating the files.
The main types of image compression are the lossy and lossless compression. The methods which are being analyzed in this thesis are DCT, DWT and BTC. They all are applied for image compression; however, they have different principles of work.
The efficiency of the compression algorithms often needs to be evaluated; it can be done either with PSNR or MSE techniques.
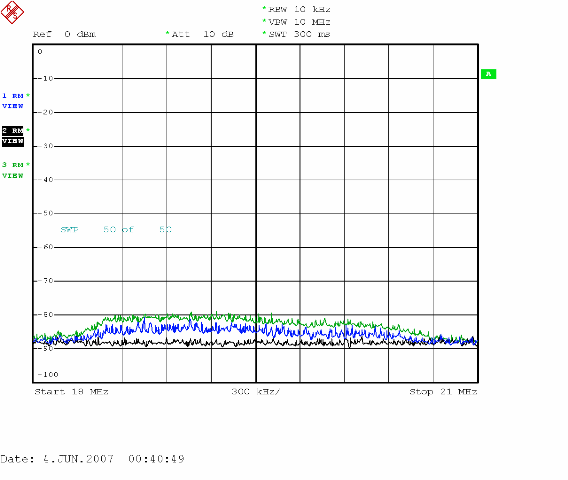
Noises in communication systems
Modern systems of communication use different transmission techniques which allow fast and efficient movement of data within the system. However, both the traditional and wireless systems suffer from the same problem. Since the power line communications were primarily designed for energy transmission, they are not perfectly suitable for data transmission. The high speed of digital circuitry has its negative effects, which are unavoidable while working with a communication system. One of these effects is noise, which occurs due to the digital signals generated by the units’ circuitry. Thus, while studying the communication systems it is extremely important to consider such phenomenon as noise.
Noise in a communication system can be explained as any undesired signal which can prove an impediment to the needed signal. There is a multitude of noise sources; it can often be caused by external disturbances and can lead to errors in a communication system.
Talking about a communication system which includes various devices like radio receivers, it is worth dividing noise into received and produced by the communication system. Undoubtedly, the system design should allow the incoming noise to be greater than the generated one.
Every communication system can resist some noises, producing no errors in its work. The measure of the noise which can be resisted is called noise immunity [39]. One system can have different rates of nose immunity when dealing with different kinds of noises; that is why analyzing the different types of noise is important. In addition, it will allow predicting the possible degradation of system performance and preventing it.
Types of noise
The classification of noise can seem to be a real challenge, as it can be classified in a number of ways. For instance, besides the mentioned division on received and produced there are many other kinds of noise according to its source, type, or effect. Some scientists [10] divide noise into two groups:
- external noise
- internal noise
External noise includes any signals which occur outside of the communication system components. Atmospheric, galactic, human made noises can all be characterized as external. In contrast, internal noise is generated by the components of the communication system. It includes thermal, shot, and flicker noise. Interestingly, the greatest risk of noise occurrence is during the first several stages of data receiving because of the low signal amplitudes.
One more phenomenon which may denigrate the desired signal is the interference with other communication sources.
For power line communications, there is such a classification of noise [13]:
- background noise, which includes:
- colored background noise;
- narrowband noise;
- periodic impulsive noise, asynchronous to the main frequency;
- impulsive noise, which includes:
- periodic impulsive noise, synchronous to the main frequency;
- asynchronous impulsive noise.
The colored background noise is caused by a number of noise sourses which are less intensive. This type of noise is strongly dependent on the frequency over a specified frequency range.
The narrowband noise can be explained as a bandlimited noise which has a bandwidth smaller than the carrier frequency. It can be caused by the amplitudes of the broadcast systems.
The third type of noise, periodic impulsive, which is asynchronous to the main frequency, is mainly caused by switching power supplies. This type of noise can be observed as repetitive impulses.
The periodic impulsive noise, synchronous to the main frequency is also realized in impulses, which have a frequency lower than in the previous type. The impulses are short and are also generated by the power supply in case if it works synchronously to the main frequency.
The asynchronous impulsive noise can occur when the transients are switched in a network. This type of noise is the most dangerous for power line communications as far as it is extremely fast and has a great spectral density, which can cause serious errors in system’s work. In addition, this type of noise needs a more detailed studying as far as it is most often observed in communication systems.
One more classification of noises [8] suggests that there are four types of noise:
- Background colored Gaussian noise
- Narrowband interferences
- AC line synchronous noise
- Impulsive noise
The other theory suggests that the noises in communication systems should b divided into:
- impulse noise, which affects the columns in the demodulator;
- permanent narrowband noise, which is hazardous for the rows of a matrix;
- Background noise, which may lead to the deletion of the frequency in the output [5].
Impulsive noise
The main characteristics of impulsive noise in a communication system which may help to recognize it are:
- the pseudo-frequency;
- peak amplitude;
- duration;
- damping factor;
- time interval between successive pulses ;
- duration of each elementary pulse in case of a burst.
Basically, impulsive noise can be caused by a number of factors. In fact, impulsive noise can be characterized as a short time-domain burst of energy, which happened either one or several times. The effect of this phenomenon suggests that this energy burst has its frequency spectrum wideband. It means that the spectrum is many times wider than the channel, but it actually disappears very soon.
The following model best describes the impulsive noise of digital transmission:
I(t) = (1 − e)S(t) + eN(t),
where e = {0, 1}.
One of the properties of impulsive noise is the time-variant behavior which introduces considerable burst errors that will affect consecutive bits especially in high-speed data transmission [35].
Additive white Gaussian noise
Additive white Gaussian noise (AWGN) is a random noise which has a frequency range wider than that of a signal in a communication system. It is not usually present in power line channels; however, it is being used with different purposes.
The additive white Gaussian noise channel model means using the Gaussian distribution of noise samples. For such model the white noise with a constant spectral density is usually added [10]. It gives the opportunity of computing the system parameters in condition of perfect environment (with no undesired phenomena like interference).
Among the models of amplifier noise, the additive Gaussian is considered to be standard. Its specific feature is that it does not depend on signal intensity and is individual for every pixel. This noise can be most often met in blue channels in color cameras, where the blue channels dominate over the red and green. Additive Gaussian noise predominantly affects the dark regions of the images.
The peculiarity of the additive white Gaussian noise (AWGN) channel is that the information is supplied in single units in this model. In fact, AWGN stands for an addition of white noise with a permanent spectral density and a Gaussian scheme of noise units’ distribution. This model creates other simple and logical mathematical schemes which can be used in order to predict the possible processes and changes in the system. However, it does not consider the processes like fading, interference, dispersion, or frequency selectivity.
A wideband Gaussian noise can occur from different sources. For example, it can be caused by shot noise, thermal vibrations of atoms in antennas, radiation from warm objects, and from different celestial sources [8].
The AWGN channel is the most convenient to use in satellites and different space communication devices. However, it is much less efficient in most terrestrial links because of the multipath and interference. On the other hand, AWGN is used in terrestrial path modeling with the aim of simulation of a chanel background noise.
Summary
In this chapter, the issue of noise in communication system was discussed. Noise is referred to as an unavoidable phenomenon in a communication system. There are several types of noise in communication systems; the basic two types are impulsive and background noise. They can be caused by a multitude of factors, among which are switching power supplies, radiation, temperature, vibration, shot noise, thermal vibrations of atoms in antennas, radiation from warm objects, and from different celestial sources etc.
The most spread types of noise in communication systems are impulsive and AWGN noise. Studying their influence on a system can help to predict and avoid the denigration of system performance.
The features which are typical for impulsive noise include the pseudo-frequency, peak amplitude, duration, damping factor, time interval between successive pulses, and duration of each elementary pulse in case of a burst. The mathematical model for impulsive noise in a communication channel is gven in this chapter.
The AWGN is mainly characterized by the wide frequency range. The information supply in this type of channel is usually realized with the help of single units.
The experimental evaluation of the influence of these types of noise in PLC and OFDM systems will be presented later in the thesis.
In general it should be noted that noises and other factors like interference greatly affect communication system performance; therefore, studying the methods of their liquidation is of a vital importance.
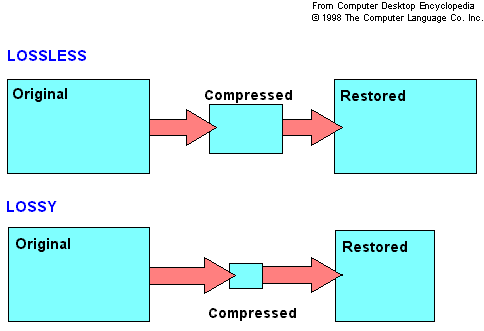
DCT, DWT and BTC coding schemes
One of the most significant points in the process of working with any sort of data is choosing not only a suitable transmission system, but also an appropriate method of compression. There is a number of coding schemes which are used for either lossy or lossless compression. They have different levels of noise resistance, spectral density, etc. Thus, depending on the desired result a particular coding scheme can be chosen. In case of working with images, an image of a particular size and format needs a specific coding technique which can best preserve its quality and visual characteristics. Therefore, in order to define the most effective technique, it is worth comparing several of them.
In this chapter we present the study of the different types of wavelets and their experimental evaluation. In addition, the discrete wavelet transform (DWT) was compared to block truncation coding (BTC) and discrete cosine transform (DCT). The compression ratio and the root-mean-squared (RMS) error of the images compressed with the methods mentioned above served as performance criteria for the experiments. The transmission was performed using FFT-OFDM with additive Gaussian noise (AWGN).
While working with the numerous results of experiments and digital data we needed some technique which would allow fast and convenient computation of the information. Thus, the technique we chose is MATLAB. It can be introduced as an international language of numbers which enables computing the different algorithms, manipulate the matrix, working with various programmes and functons.
MATLAB can be applied in a number of fields. We are interested in its implementation in signal processing and dfferent kinds of communications. We found it very convenient to use as its results can be easily combined with or converted to the symbols of other programming languages.
We utilize MATLAB to conduct the simulations in this chapter. The simulations are carried out using 100 realizations.
OFDM system design
The system design can be expressed mathematically in the following way. OFDM takes a block of encoded signal (in the complex form: D(k) = A(k) + jB(k)) and performs an IFFT on the symbols in this block before modulating in the resulting IFFT spectra onto orthogonal carriers and transmitting. Suppose the data set to be transmitted is:
D (- Nc/2), D (- Nc/2 + 1), …, D (- Nc/2 – 1), where Nc is the total number of subchannels. The discrete-time representation of signal after IFFT is [49]:
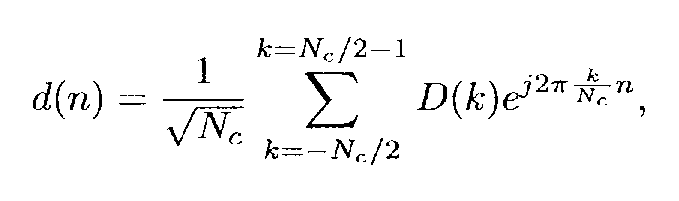
where n Є [- Nc/2, Nc/2]. At the receiver the opposite occurs with the receiver determining the carrier the information is modulated on and decodes the data via an FFT process [7; 26]:
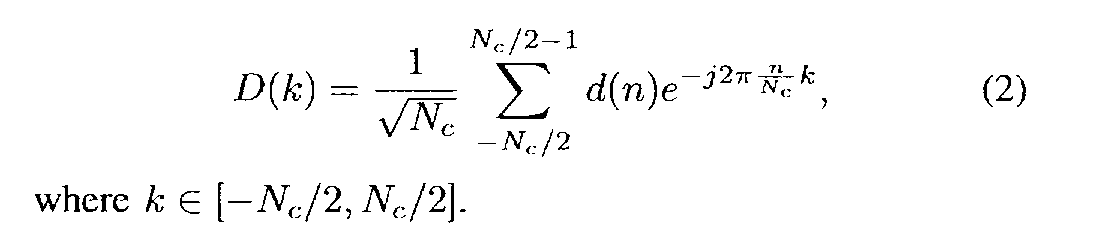
This whole procedure increases the efficiency of the limited bandwidth use in a wireless channel for the transmission of data. However, OFDM suffers from several challenges due to the multi-path channel through which the signal is propagated such as the inter-symbol interference (ISI) and inter-channel interference (ICI). Cyclic prefix is a crucial feature of OFDM used to mitigate the ISI and the ICI.
At the receiver, a specific instant within the cyclic prefix is selected as the sampling starting point Tr, that should satisfy the following timing constraint to avoid the ISI Tm < Tr < Tg, where Tm is the worst-case multipath spread delay and Tg is the guard interval.
Our system, shown in Fig.(2), was designed using MATLAB simulation software to transmit and receive a grayscale, 256 x 256 pixel image by using the OFDM transmission algorithm over a wireless channel.
To increase the efficiency of this system we also employed the Discrete Wavelet Transform (DWT) for the compression of the image before transmission. The following is a description of our system’s transmitted and received blocks.
Transmitter
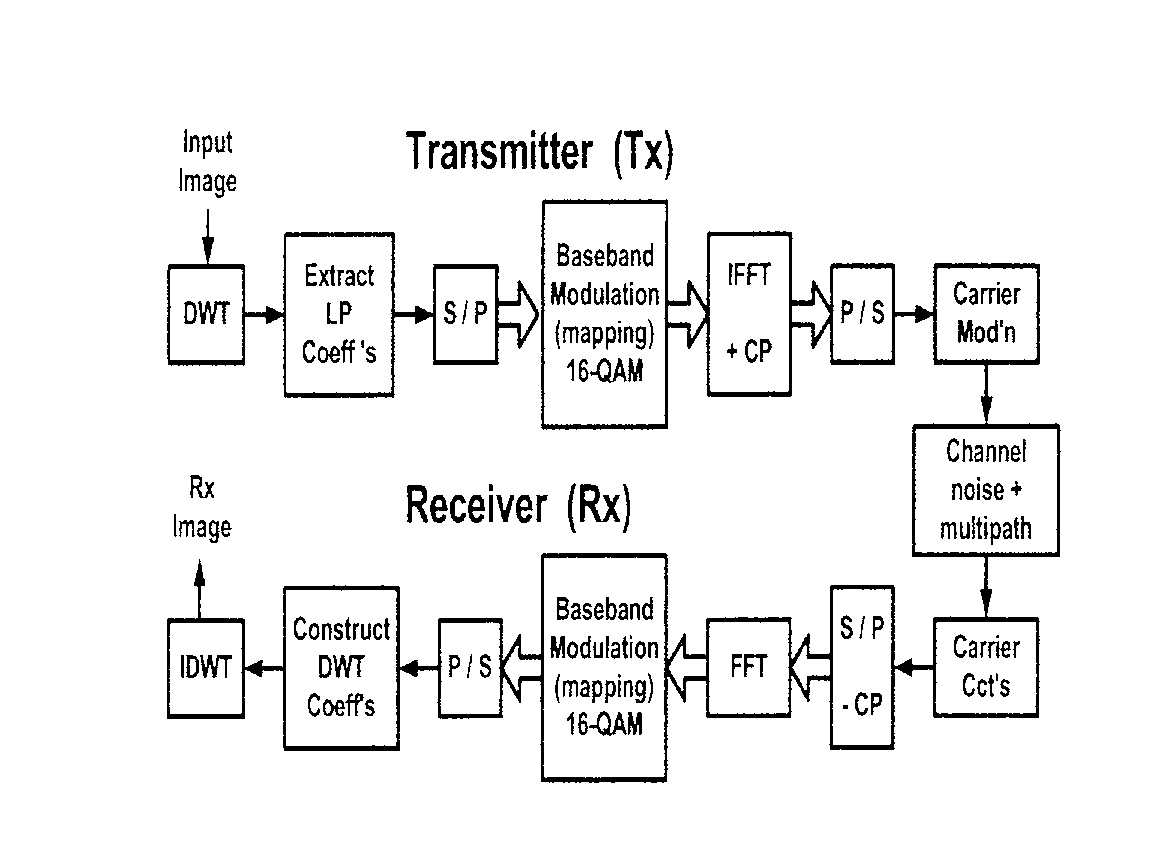
A grayscale image of 256 x 256 pixels is input into our system, a Discrete Wavelet Transform (DWT) was then performed on our image to extract the detail coefficients for our image. To compress the image to make transmission more efficient we then passed these coefficients through a filter block to extract only the low pass coefficient and remove all the high pass detail coefficients. These coefficients were selected as they contain the image component the human eye is most sensitive to [21].
Following these low pass coefficients being extracted scalar quantisation is applied and the result was converted from decimal to an 8 bit binary string in preparation for modulation.
The modulation scheme adopted here is a 16-QAM. The modulated data is then transmitted over a wireless AWGN channel with five multipaths fading had been assumed. In order to fit the MATLAB sampling time and avoid a long period of simulation, there was made an assumption that the transmission is achieved in baseband.
Due to the MATLAB sampling time, it is assumed that the transmission is achieved in baseband to avoid long period of simulation.
Receiver
At the receiver a version of the sent data is received but corrupted with channel distortion and AWGN. The first process used to demodulated the signal is to rearrange the received bits into parallel form and perform an FFT on the data, this data then needs to pass through an equalizer (we assumed perfect channel estimation at the receiver) to remove as much of the channel distortion as possible and determine the most likely 16-QAM symbols received. These symbols are then demodulated, converted back to a serial stream before being converted back to decimal. The resulting data was then compared and the root-mean squared error (RMS) was calculated.
Discrete cosine transform (DCT)
The DCT – II is the most commonly used form of DCT compression due to its computational convenience. The DCT can be defined as an invertible N × N square matrix; therefore, we used the DCT2 in a following way:
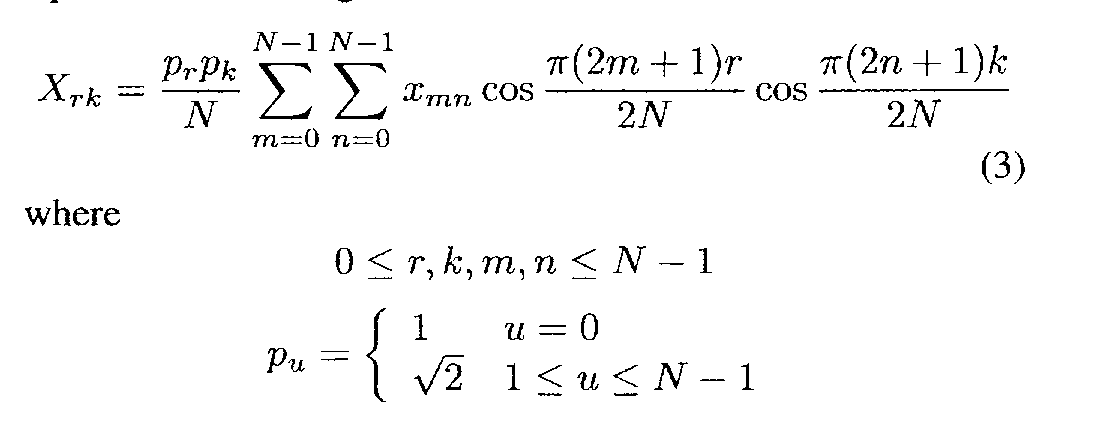
while the DCT3, an inverse form to the DCT2 (also called as IDCT2) is defined using this equation:
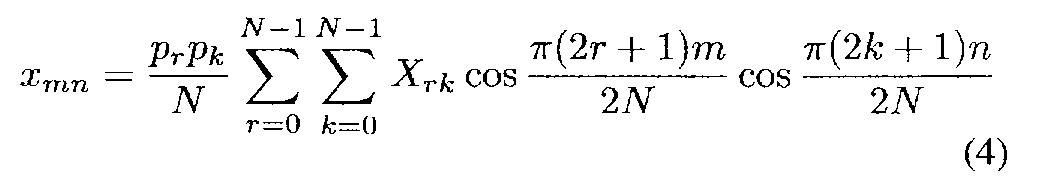
The DCT can be calculated using the FFT algorithm as it is closely related to Fourier transform. However, the defining feature of DCT is that it gives real coefficients for real signals and uses only cosine functions. Both DCT1 and DCT2 give more weight to low-pass coefficients than to high-pass coefficients. Hence, we can compress by defining a cutoff threshold and ignore coefficients less than this threshold. As we are comparing performance with wavelet transforms, we impose a compression ratio to define this threshold. The compression ratio (CR) is defined as:
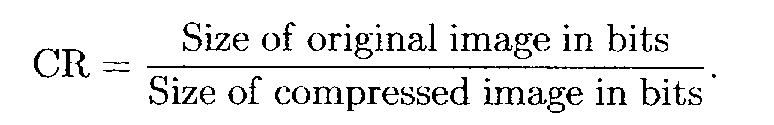
Error and compression ratio for DCT
For the discrete cosine transform (DCT) the compression ratio is defined before the compression of the image while with the wavelet transforms the compression ratio is completely dependent on the type of wavelet being used. Fig.(2) shows the relative RMS error obtained from our system when using the DCT as the compression algorithm; four different compression ratios have been chosen for analysis including the compression ratios of 2.1, 2.5, 2.8 and 3.
The relative RMS error is defined as:
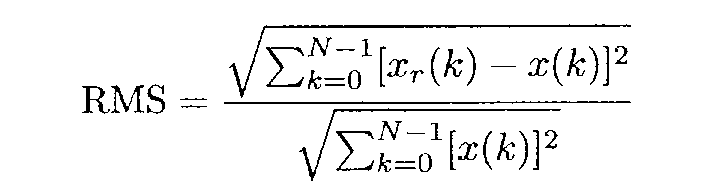
where xr is the received image.
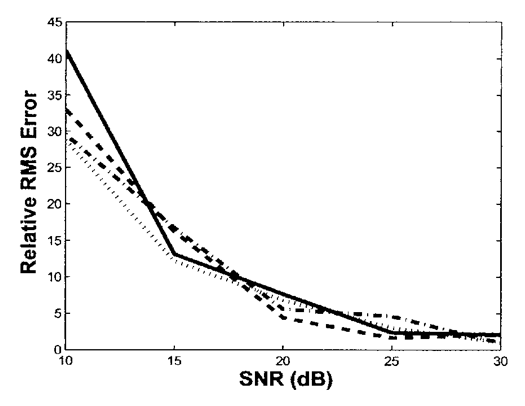
Fig.(2) also shows that, generally speaking, for all compression ratios there is a significant decrease in the error as the SNR increases. For lower SNRs less error was obtained when using a compression ratio of 2.8 while at higher SNR all compression ratios obtained as comparable error rate.
Discrete Wavelet Transforms (DWT)
The decomposition of any given signal into many functions can be realized through translations and dilations of a single function called a mother wavelet, defined as A(t). Using the translations and dilations of A(t) the following function is generated [30]:
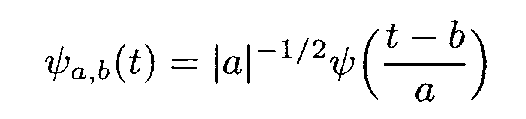
where a defines the dilation factor (the scale) applied to the mother wavelet and b defines the shift applied. The discrete wavelet transform version is
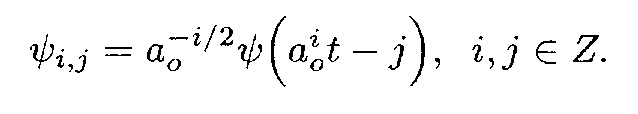
Often ao = 2 is chosen. The discrete wavelets can be generated from dilation equation, such as
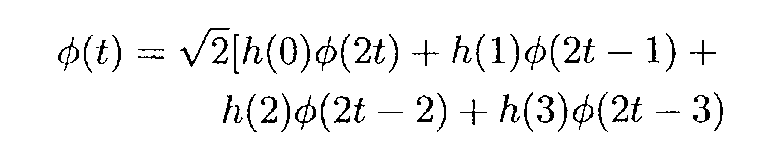
Solving (5), one may obtain the scaling function A(t). Different set of parameters h(n) can be used to generate different scaling functions. The corresponding wavelet can then be obtained as follows:
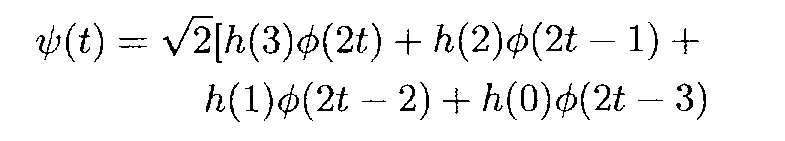
Generally, if one consider h(n) as a low-pass filter, then a high-pass filter, g(n), can be defined as g(n) = (-1)nh(M – 1 – n) (11)
These filters (h and g) are called quadrature mirror filters (QMF). Now one may define the scaling function in terms of the low-pass filter as
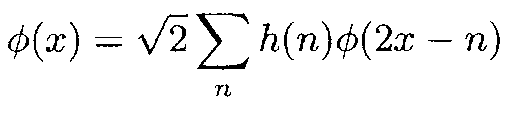
while the wavelet function is defined in terms of the high-pass filter as
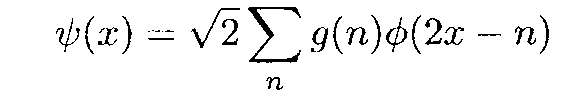
These QMF can be used to decompose and reconstruct a signal. This transformation is used to give information representing time and frequency information in the original signal.
In image processing, 2-dimensional wavelet transforms can be employed, which use a scaling function A to scale A(t) in 2 dimensions. The resulting 2-dimensional wavelet transform produces coefficients from the image. These coefficients represent horizontal as well as vertical and diagonal detail coefficients stored within the original image. These detail coefficients are considered to be high pass and are coupled with low pass coefficients which represent a low resolution version of the original image [21].
In this study we consider the low-pass coefficients extracted from our image and disregard the high-pass coefficients. The high-pass coefficients extracted from the DWT are essential for a true, lossless reconstruction of the original image but contain very little information the human eye is sensitive to. Therefore, it can be expected that by disregarding these coefficients we can compress the image substantially, in this way improving the transmission efficiency, but in doing so it will also result in a decrease in the quality of the received image.
One major advantage of wavelets over Fourier analysis is the flexibility they afford in the shape and form of the analyzer. However, with flexibility comes the difficult task of choosing (or designing) the appropriate wavelet for certain application. This study will analyse five different types of wavelet families to determine whether these can contribute to the overall efficiency and accuracy of our system.
Wavelets and their peculiarities
The wavelets used for this study are: Haar, Daubechies, Symlets, Coiflets, and Biorthogonal. A brief description of the major properties of each wavelet family is given below, [17], [29], [32], [54].
- Haar wavelets are the simplest and oldest wavelet. It is identical to db2. Among all orthonormal wavelets, Haar has the shortest compact support, orthogonal and symmetric. Since Haar has only one vanishing moment, it is effective for locating jump discontinuities. Haar uses the exact same wavelet for the decomposition and reconstruction process, therefore providing perfect symmetry.
- The Daubechies family are compactly supported wavelets for any given number N of vanishing moments. In the Daubechies family there are more than twenty wavelets. For higher orders wavelets, their gain of asymmetry decreases. The length of the Daubechies filter is 2N since they have the minimum number of non-zero coefficients.
- The Symlets family is similar to the Daubechies family so they are constructed the same way. For a given compact support, the Symlet wavelet family has the least asymmetry and highest number of vanishing moments. The length of the filter used is exactly the same as the Daubechies family which is 2N.
- Coiflet wavelets are designed in a similar way to the Daubechies family, but overcoming a substantial limitation of Daubechies family, particularly the symmetry. The Coiflet wavelets are compactly supported, with a maximal number of vanishing moments for both phi and psi. However, the vanishing moments are equally distributed between the scaling function and the wavelet function.
- The Biorthogonal wavelets are compactly supported; symmetrical and exact reconstruction is possible with FIR filter. This is due to their unique way in whichnthey use the wavelet type for decomposition and another wavelet for reconstruction. However, Biorthogonal wavelets are not orthogonal. In addition, they have a specified number of vanishing moments with a minimum size support.
DWT and its effects on compressed ratio
The results in Fig.(3) to Fig.(6) show a comparison between the different wavelet families used in the experiments in terms of the compression ratio. The compression ratio is independent of SNR and is purely dependent on the type of wavelet used and its order.
The figures clearly show that the Daubechies 1st order (Haar) wavelet transform and the Biorthogonal 1.1 transforms have the highest compression ratios of 3 compared to all the other wavelets. In addition, Daubechies 2nd order and Summlets 2nd order compresses well with a compression ratio of 2.9081 each closely followed by Symmlets 3rd order, Coiflets 1st order and Biorthogonal 1.3 all with a compression ratio of 2.8491 as shown in the figures. Generally speaking, as the wavelet order increases in each wavelet family, the compression ratio decreases.
Table I. RMS error for DCT and various wavelet families.
Table I gives a summary of the root-mean square (RMS) errors obtained from the experiments conducted. Compared to the DCT, the DWT gives substantially less error over all SNRs but a significant improvement can be seen for low SNRs of less than 20 dB for the DCT.
From Table I an analysis has been performed of the root mean square (RMS) error for each of the SNRs used and each of the wavelets used. As expected the RMS error for each wavelet increased as the SNR decreased with very similar performance over all wavelets with respect to noise.
The wavelet transforms that performed particularly badly though included the Biorthogonal 3.1 which had a much higher RMS error over all SNRs as well as Symmlets 5 which also performed worse in the Symmlets family for low SNRs.
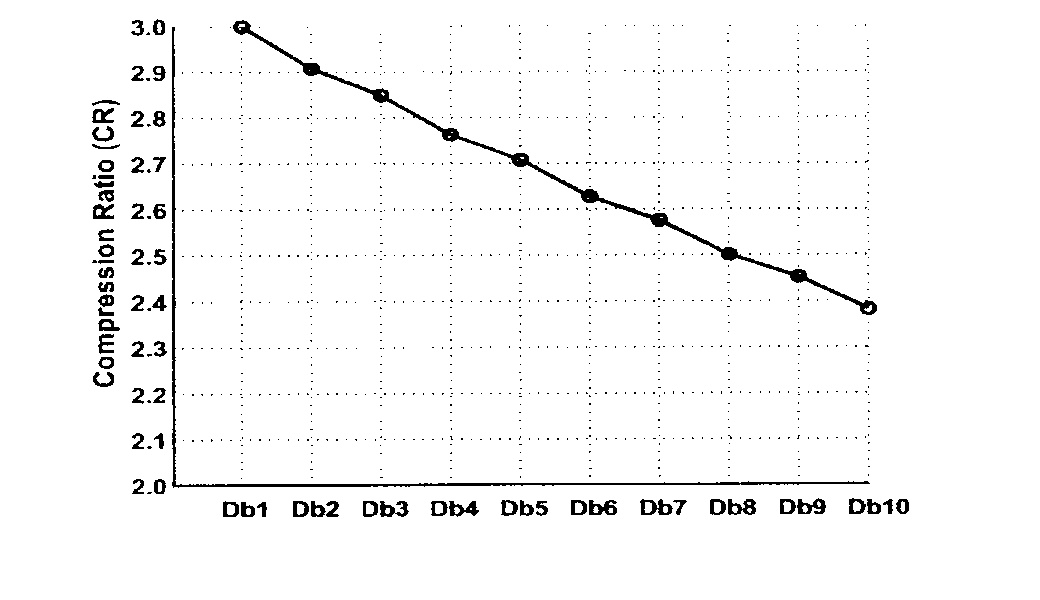
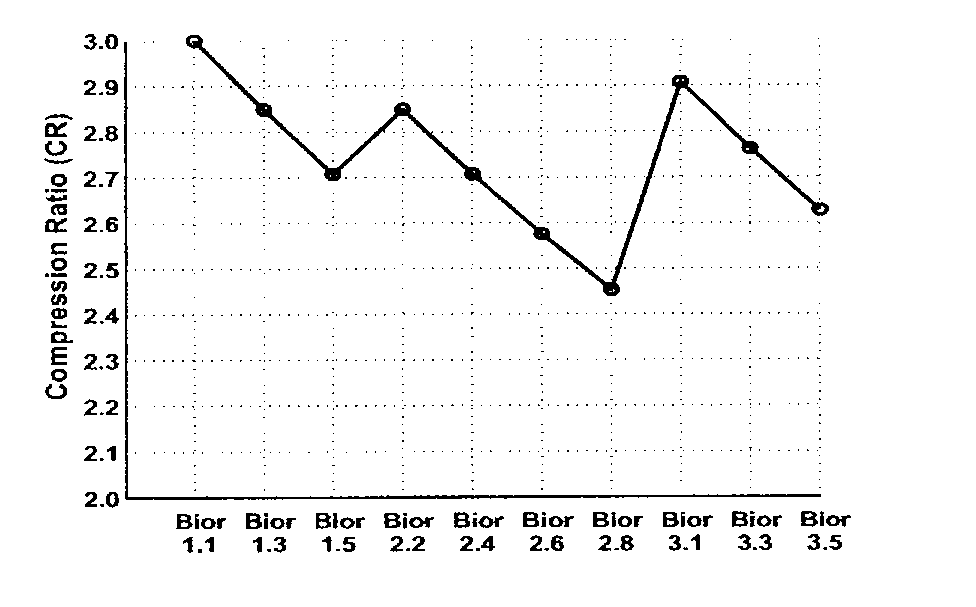
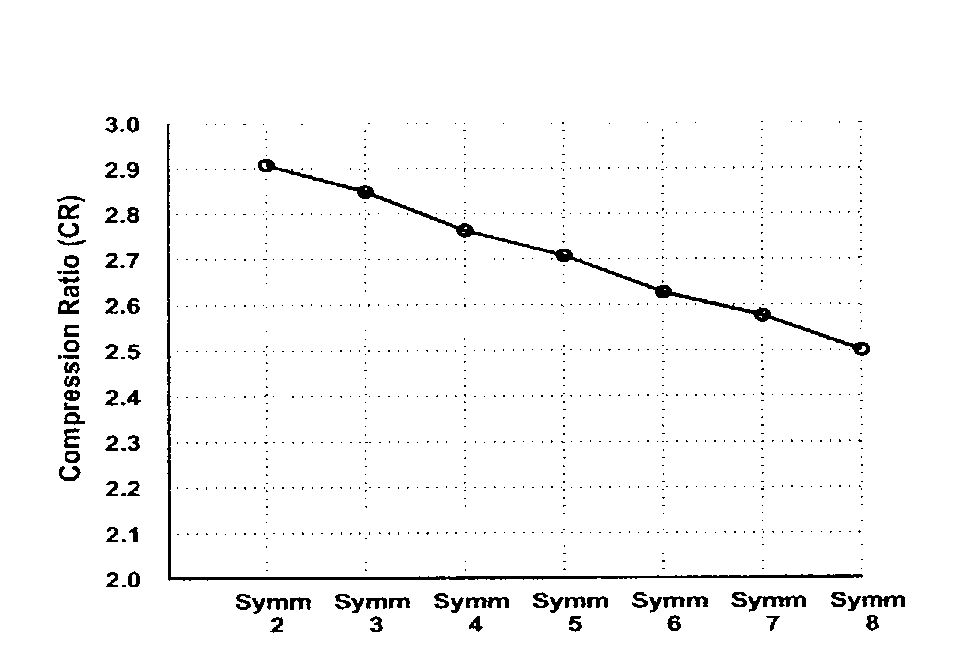
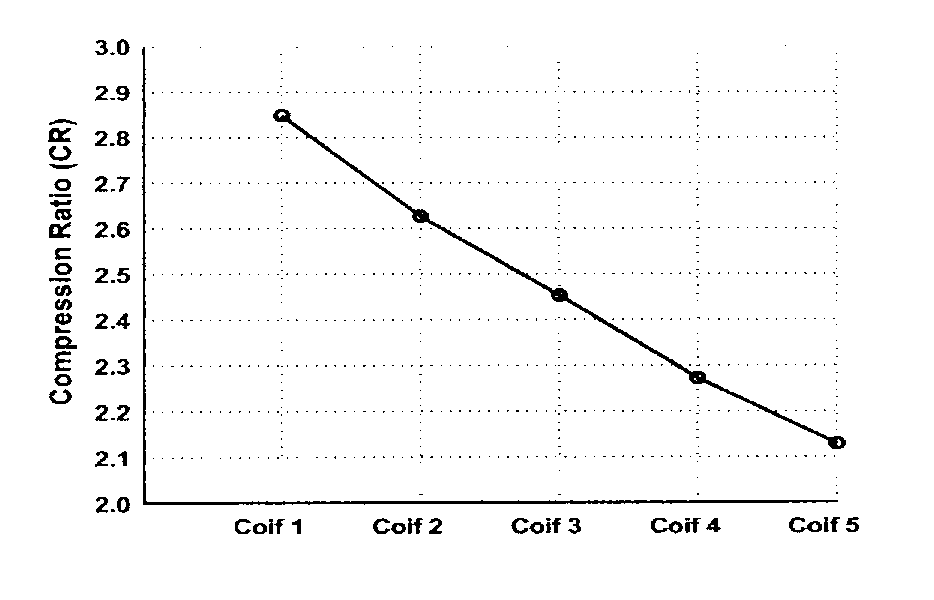
BTC
For an input pixel block xi where i = 1 to m, the two output levels of quantizer of each block are given as [22]
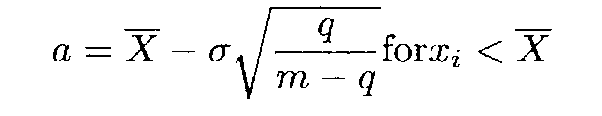
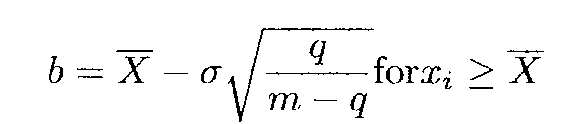
where m is the total number of pixels in each block, q is the number of pixels greater than or equal to X. The sample mean X and standard deviation . are defined as
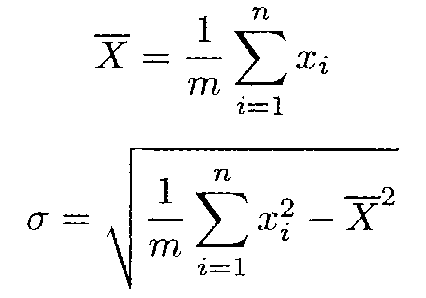
In this study, we decompose the original image into blocks of 2 x 2, 4 x 4, and 8 x 8, and compute the average pixel values of every image block. If the pixel value is greater than the average value of the image block, the pixel is assigned bit 1; otherwise (i.e. lower than the average value), the pixel is assigned bit 0. The next step, we compute the average pixel value of bit-1 pixels of the block to get a high-part average value of the block, and also compute the average value of bit-0 pixels of the block to get a low-part average value of the block (Figure (2)).
Both the above- and below-part average values are recorded and appended after the codeword for assisting to recover the image. Figure (2) shows original and simplified image block after processing, the pixel values of the gray-level image are replaced with bit 0 or bit 1. Therefore, the number of possible patterns of image blocks is degraded from 25616 to 216.
Experimental comparison
Investigating the effect of AWGN in the OFDM channel on the compressed image, we chose two compression methods, which are DWT and BTC. They have different size of blocks, and therefore the process of coefficient extraction in DWT differs from that in BTC. For instance, in DWT, the high-pass coefficients are disregarded and only the low-pass coefficients are transmitted. These coefficients are quantized using 8-bit levels. In contrast, in BTC, the coefficients are extracted according to the size of blocks using a quantizer to reduce the grey levels while maintaining the same mean and standard deviation.
One vector is produced after combining the bit-map matrix, the quantized lower mean, and the quantized higher mean, which is transmitted over FFT OFDM channel. It proved to be senseless that the channel impulse response is assumed to be constant throughout OFDM frame. Moreover, in the multipath channel, SNR is defined as ratio of average QAM-symbol energy over noise-energy per QAM-symbol and the power due to cyclic prefix is ignored since it has no overall effect.
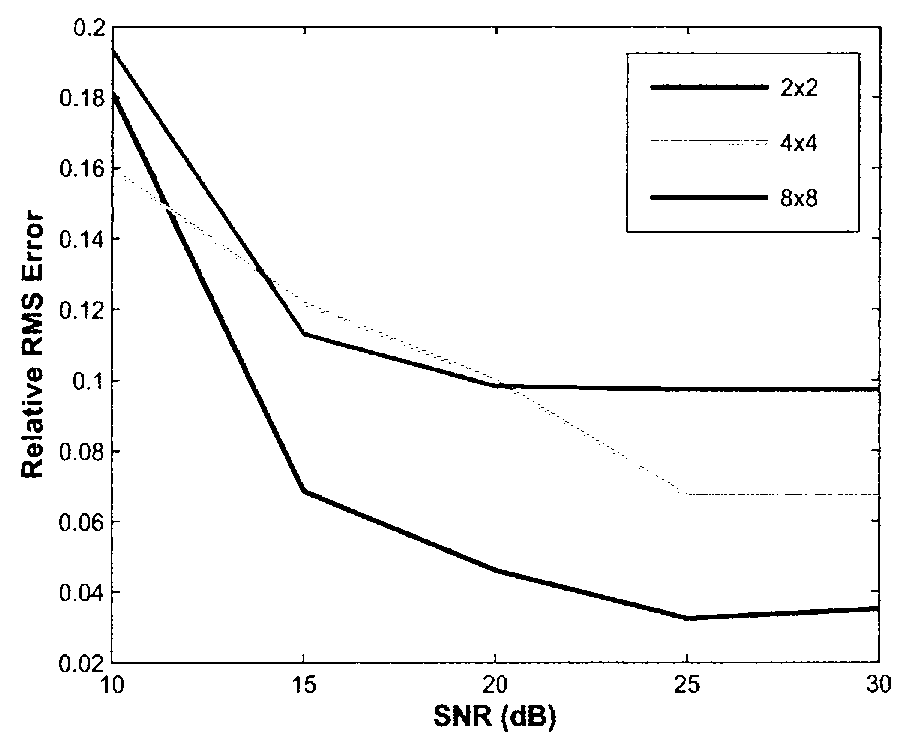
Figure(7) shows the relative RMS error obtained from our system when using the BTC as the compression algorithm.The relative RMS error is defined as:
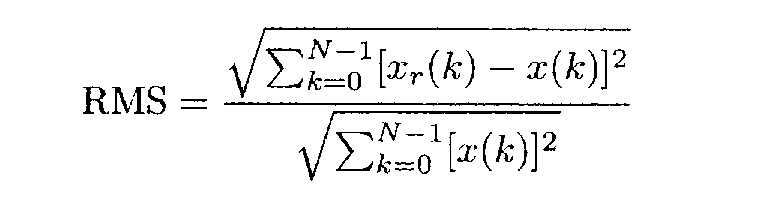
where xr is the received image.
Generally speaking, for all size of blocks there is a significant decrease in the error as the SNR increases. As the compression factor (CF) increases, the relative RMS increases at higher SNR.
Table II: RMS error for BTC and DWT.
Table II gives a summary of the RMS errors for each of the compression algorithms used at each SNR obtained fromthe experiments conducted. Compared to DWT, the BTC gives substantially less error over all SNRs.
As we are comparing performance in terms of compression factor (CF), for DWT it is defined as:
While the CF for BTC is defined as:
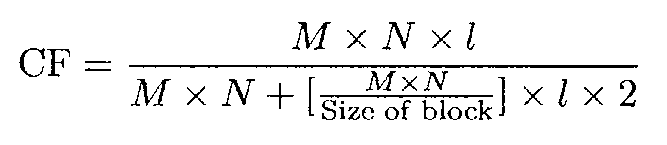
where M x N is the size of our image, and l is the number of bits per pixel.
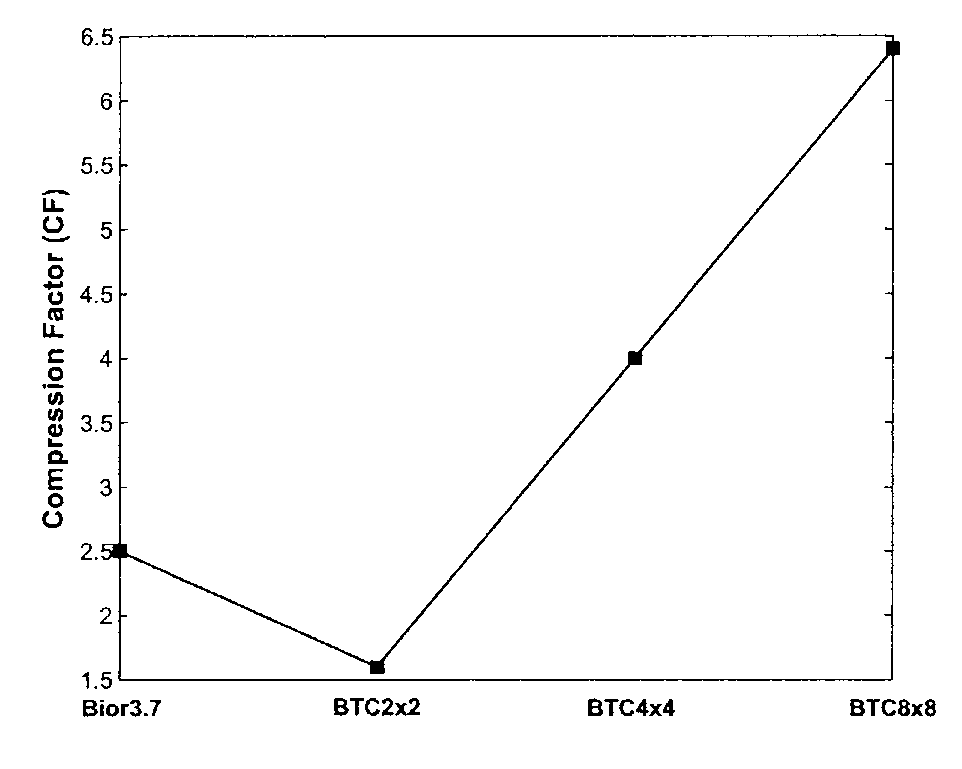
The result in Figure (8) shows a contrast between DWT and different sizes of block used in BTC, in terms of CF. It can be clearly seen that the CF of BTC is higher than DWT. According to block size, the 2 x 2 has the lowest CF than both the other size of blocks and DWT.
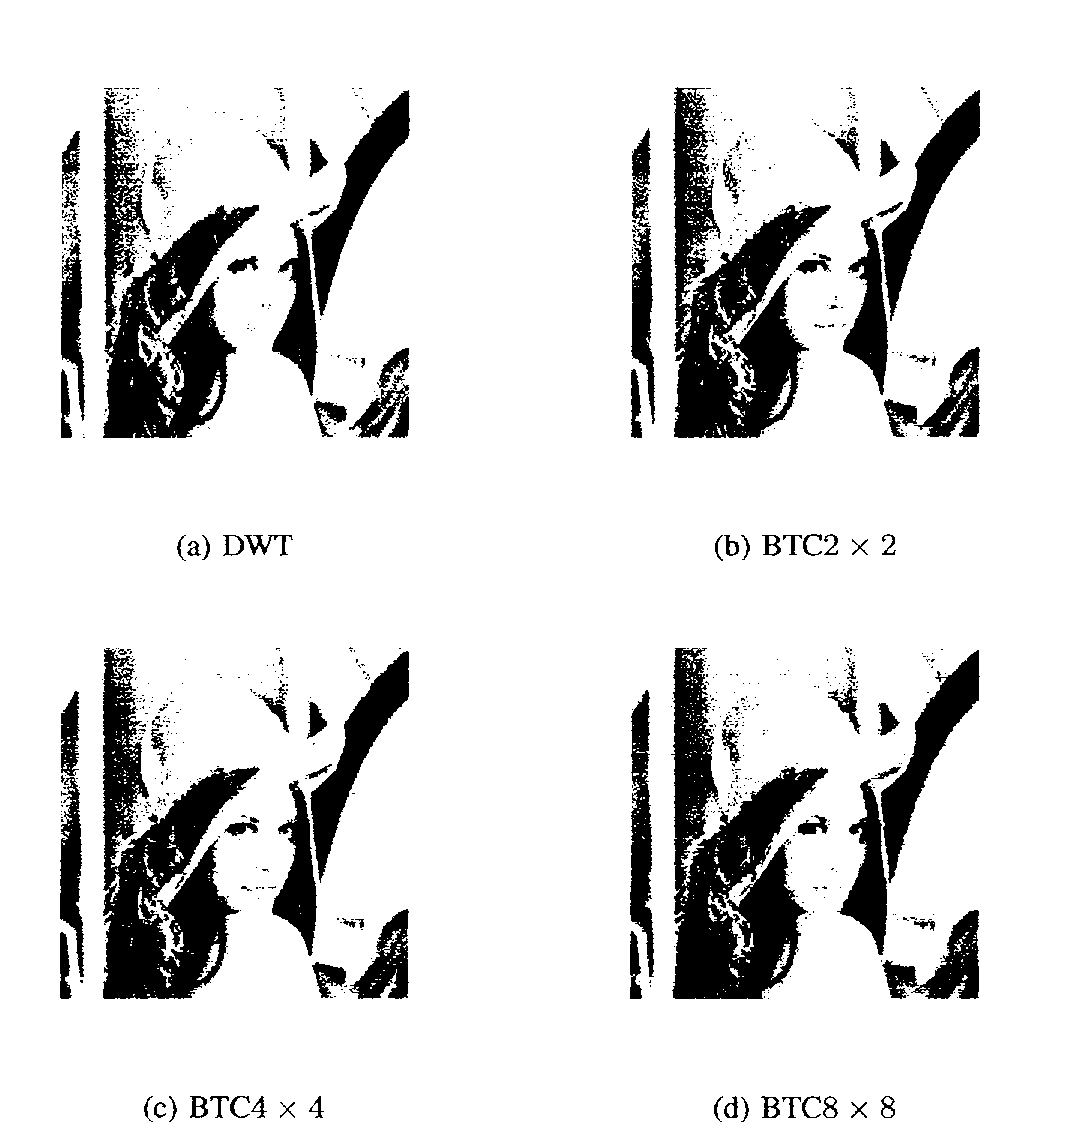
Figure (9) shows a comparison of reconstructed image for different compression methods.
Summary
In this chapter we presented the DCT and DWT compression schemes using the OFD modulation. We applied these algorithms in the experiments and compared the results.
The experiments conducted showed that the DCT transform commonly used in JPEG compression performed poorly when used in FFT-OFDM wireless communication systems. The DWT performed well over all SNRs with very similar errors over all wavelets and wavelet orders for high SNRs of 25 – 30 dB.
Wavelet order, however, did affect the compression ratios with an obvious linear decrease in compression ratio when wavelet filter order is increased, this was apparent over all families of wavelets.
We also studied the different families of wavelets and their performance. In terms of image compression the Daubechies family and the Biorthogonal family performed the best. At the same time, in terms of error the low filter orders in these two families gave less error in comparison with the Daubechies first order and Biorthogonal 1.1 order wavelet transforms’ results.
We also included the evaluation of the compression factor while comparing the algorithms. The experimental comparison between DWT and BTC for compressed image transmission showed that BTC has a better performance than DWT with lower compression factor and lower RMS over all SNRs. In terms of computational complexity, the BTC method is more complex than DWT method. This is due to the fact that when using BTC algorithm we process the image in spatial domain and extract the coefficients locally. In contrast, when applying DWT we extract the coefficients globally. Furthermore, the compression factor for BTC with size of block 2 x 2 proved to be less than that of the DWT. However, both quality and RMS for BCT appeared better than for DWT.
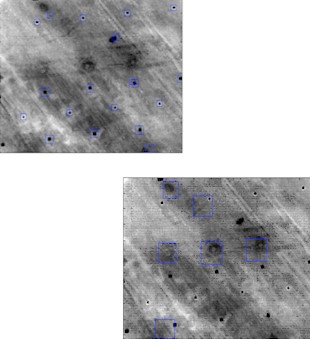
Optimum Wavelet Thresholding
Earlier in the thesis, we have presented the main methods for image compression. However, besides the mentioned techniques, the compression of images before transmission can also be realized with the help of a technique which is based on using the DWT with quality assessment based thresholding (QUABT). Thresholding is used in image processing as one of the techniques for image segmentation. In general, the process of thresholding means division of the pixels of image into background and object. This division is realized according to the pixels’ value; these pixels are then colored as ether white or black.
It colors all the pixels which belong to the thresholding interval with white; all the other pixels are given a black color. Thus, thresholding can transform a grayscale image into a binary one. The QUABT has a slightly different technique, which is aimed at a rather efficient segmentation and coloring of the images. After all, the high quality of images is the key problem, and different methods of its resolutions have been offered in this study.
Image quality assessment
The importance of visual quality measurement is hard to overestimate while working with processing applications of images and video of large size. Despite the advancement in digital images, there still exists the problem of automatically assessing the quality of images or videos in agreement with human visual system. The visual quality of digital images is put under the threat of being degraded during different processes.
For instance, the acquisition, procession, storage, transmission, and reproduction can cause a wide variety of distortion in the image [43]. Thus, in order to retrieve an evaluation of the performance of quality assessment (QA) algorithms it is extremely important to measure the visual quality of the data throughout all the applications. It should be done regardless of the type of the distortion corrupting the image or strength of the distortion [3].
The standard approach that researches have focused on is measuring the quality of the image with the “reference” or “perfect” image. This paragon is modulated according to the human visual evaluation, as far as human beings are the consumers of all images and videos. However, it is also of vital importance to get quality scores for the data which have a close enough agreement with the human assessment of quality [1; 2; 3].
The most widely used full-reference image QA is the mean-squared error (MSE). To make it more clear, the MSE of an estimator is one of the possible ways to express the differences between an estimator and the true value of the quantity being estimated in numbers. MSE is a number, not a random variable. Its value can be found by averaging the square intensity differences of distorted and reference image pixels along with the signal-to-noise ratio (PSNR).
PSNR stands for the ratio between the maximum power of a signal and the power of corrupting noise which influences its fidelity. It is widely used as a measure for the quality of representation of lossy compression codecs, and therefore is relevant in the study of image compression. It is also worthy mentioning the fact that the typical values for the PSNR in lossy images and videos compression fluctuate between 30 and 50 dBs, and the higher value is more desirable.
Despite the simplicity of the error-sensitivity based approaches mentioned before, they are not well correlated with the perceived visual measurement [1]. Thus, a recent QA measure is the structural similarity (SSIM) index [3]. This approach is based on the assumption that human visual system has an ability of adaptation to exact structural information of a particular image. The SSIM index serves as a measurement of image quality. It refers to the initial uncompressed or undistorted images and is applied as the improved method in comparison to the traditional ones, such as PSNR and MSE mentioned before.
Another challenging task of the image compression and transmission is the trade-off between the compression ratio and image quality. Specifically, when a lossy compression is applied to an image, a small loss of quality in the compressed images is tolerated. Therefore, there is a need of an adaptive optimization of the latest developments in quality assessment techniques to the type of image application which the compression is being used for.
The traditional image quality assessment techniques, such as mean-squared error (MSE) and peak-SNR, suffer from well-known pitfalls [1]. The main aim of the QA research is to design algorithms which can automatically evaluate the quality of the image or video in a perceptually consistent approach. Generally, image QA techniques represent image quality as fidelity or similarity with reference image in certain perceptual space.
The SSIM, as it was already mentioned in this study, is an algorithm used for measuring similarities between two images. Promising results were achieved due to the fact that this algorithm proved to be consistent with the human eye perception.
The most rational way of solving the technical problems is to compound the values and actions in a formula. Namely, assume that x and z are the nonnegative image signal vectors. The similarity measure is divided into three comparisons, which are luminance (l (x, y)), contrast (c (x, y)), and structure (s (x, y)). In fact, these three components are relatively independent on each other. Now, if the first signal vector x is considered to be perfect, then a quantitative measurement for the second signal (y) can be obtained from the similarity measure. When the combination of these three comparisons functions correctly, the overall similarity measure will be as fallows:
S (x, y) = f (l (x, y), c (x, y), s (x, y)) (1)
These three functions should be defined as well as the combination function in order to have the complete definition of the similarity measure. For instance, the luminance comparison can be defined as
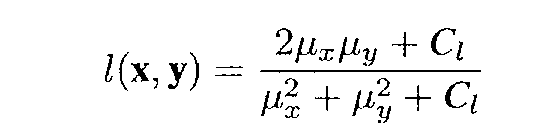
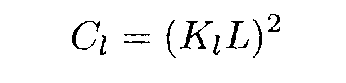
where L is the dynamic range of the pixel values, and Kl is a small constant. Likewise, the contrast comparison function follows a similar form as the luminance comparison function
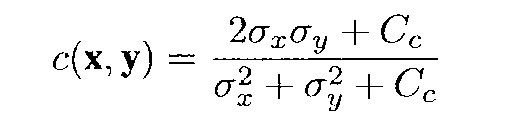
The structural comparison is conducted after luminance subtraction and luminance normalization. Thus, the structural comparison function is defined as follows
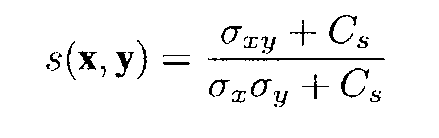
This function is derived from the correlation between Cc = (KcL)2 which is equivalent to the correlation coefficient between x and y. The small constant can be estimated as
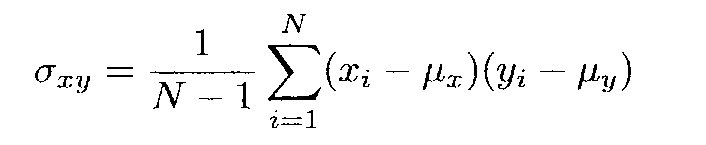
The resulting similarity measure is named as SSIM index after combining the three comparisons functions to obtain a simplified definition as follows

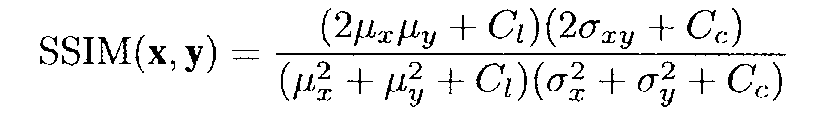
Generally, a single overall quality of the entire image is required for evaluation. Therefore image quality assessment is applied using the SSIM index. An 11×11 circular symmetric Gaussian weighting function
g = gi|i = 1, 2, …, N is used, with a standard derivation of 1,5 samples, normalized to unit sum
The parameter settings for Kl and Kc are 0.01 and 0.03, where it was found that the performance of the SSIM index algorithm is insensitive to variations of these values. Therefore, a mean SSIM index is used to evaluate the overall image quality as
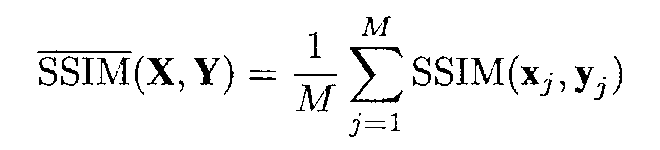
where X and Y are the reference and the distorted images, respectively; xj and yj are the image contents and the jth local window; and M is the number of local windows of the image.
Experimental results and discussion
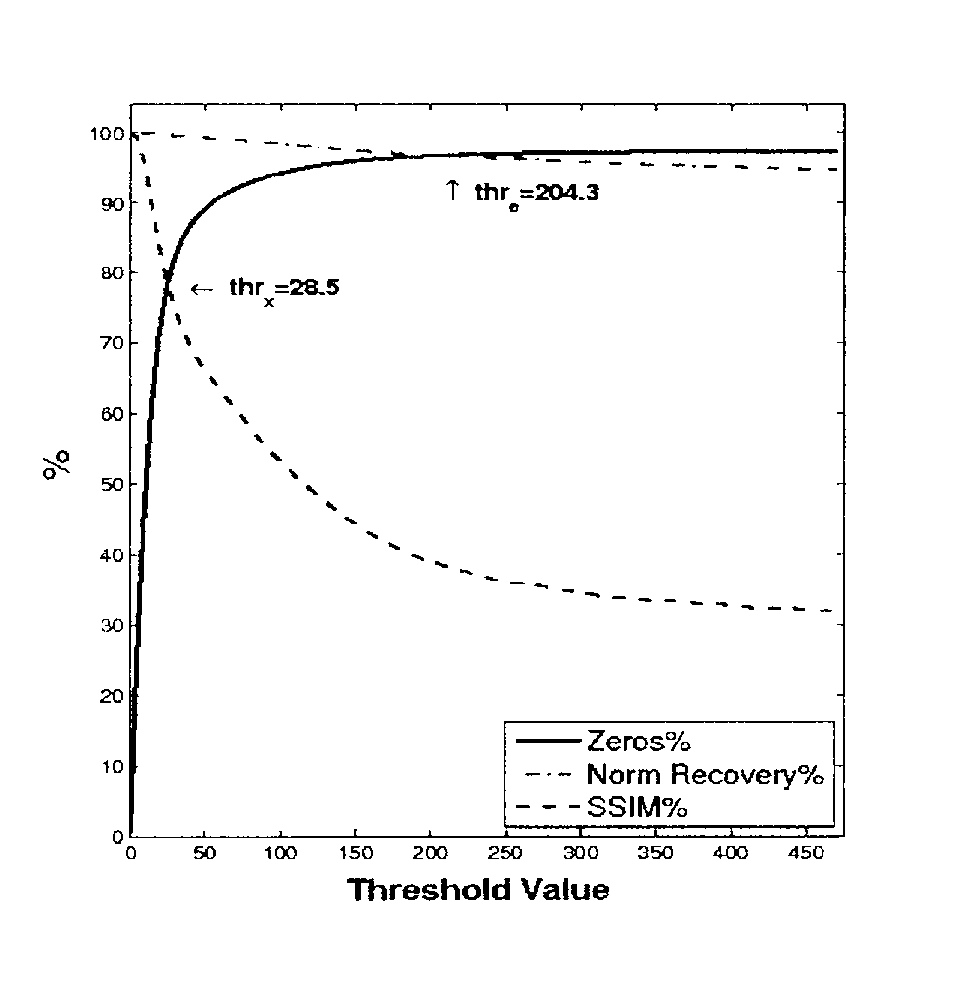
To improve the transmission efficiency of wavelet compressed images over OFDM systems, an optimum threshold value has to be carefully selected. This threshold should achieve a good trade-off between image compression ratio and image quality. In order to optimize the selection of the threshold value for wavelet coefficients thresholding, MATLAB is employed to calculate the relation between the threshold value and four different aspects of the compressed image.
These are:
- the number of wavelet coefficients that are set to zero. These zero are normally grouped in clusters, and eventually these clusters will be encoded using some lossless compression technique such as run-length. Hence, the summation of these zero clusters is directly related to the aggregate compression ratio (lossy and lossless).
- Energy preserved by the compressed image, and
- image quality assessment measured in terms of the mean SSIM.
The outcome is summarized in Fig. (3), which shows the variation of these characteristics against the threshold value used in wavelet thresholding (prior to transmission).
Two intersection points are observed from Fig.(3). The first is the intersection point between the zeros and the SSIM curves (thrx), which is of particular interest. The second is the intersection point (thre) between the zeroes and the energy curve, which is used as a traditional thresholding approach in image compression.
For the purpose of comparison, thrx and thre are examined against MATLAB default threshold (thrd) so as to decide on the optimum threshold. The default threshold of compression, thrd si defined as
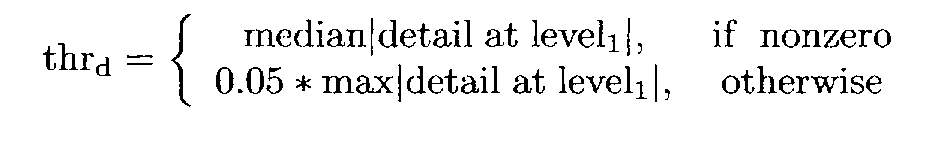
To verify the results, a gray-scale image of 256 x 256 pixels is compressed using each of the above thresholds (through the system shown in Fig.(1)) and then transmitted using the OFDM system shown in Fig.(2). The achieved compression ratios using RLE and the reconstructed image for each of the above mentioned scenarios are added as Fig. (4). It shows the original “reference” image under consideration. After reception, the reconstructed images are shown in Fig.(5) along with their corresponding number of zeros per cluster distribution beneath each image. MATLAB default (thrd), zeros-SSIM intersection (thrx), and zeros-norm intersection (thre) thresholds are used to compress the image at the transmitter side as illustrated in Fig.(5) respectively.
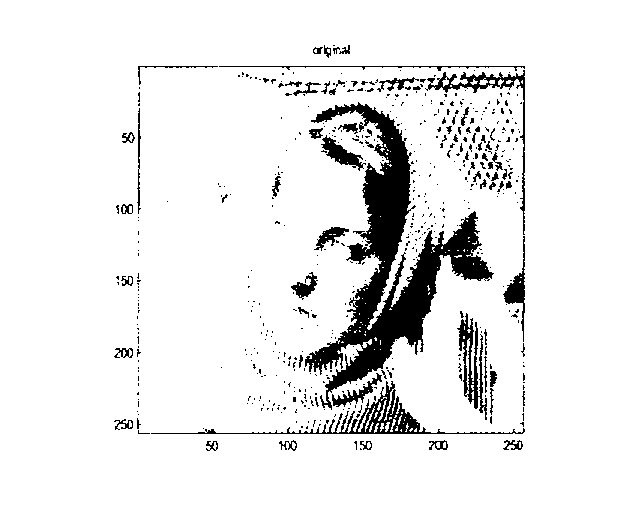
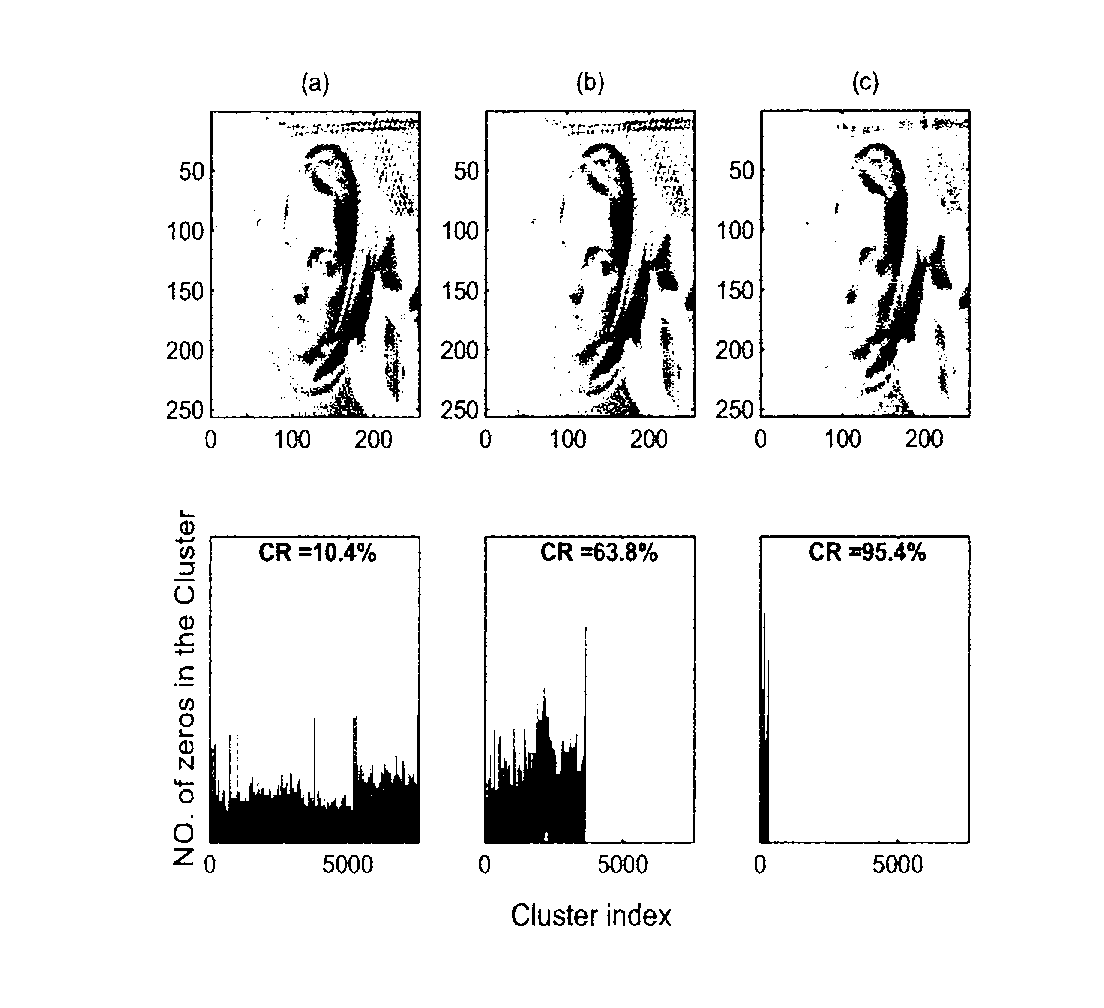
Table-I illustrates a comparison among these thresholding techniques based on the number of zero-clusters, the mean length of the zero-clusters, the compression ratio (CR%), and the quality of image (using SSIM index. It is obvious that the SSIM index table is in conformation to the human visual perception. According to this comparison, one can notice extreme values regarding the CR% and SSIM index in the case of default and energy recovery thresholding methods. Very good image quality in the former thresholding, however, is at the cost of a low compression ratio, whereas in the later case the situation is quite reversed.
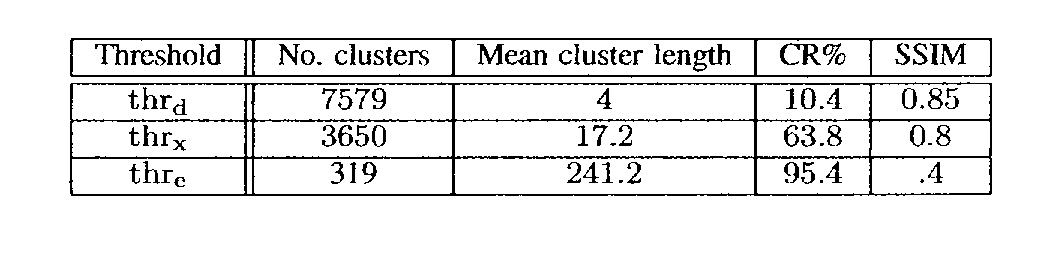
On the other hand, the intersection point between the SSIM and zeros-cluster curves (thrx) achieves a relatively high compression ratio (>60%) while maintaining a very good image quality (SSIM = 0, 8). Hence, thrx provides the best possible trade-off between CR and image quality. Even in applications that require high image quality, one would choose to employ the Zeros-SSIN thresholding instead of the default one as they are comparable in image quality performance (about 5% degradation), yet the Zero-SSIM method outperforms the default method by an order of magnitude.
Summary
In this chapter, an optimum wavelet thresholding technique for segmentation of images compressed and transmitted over OFDM links is proposed. The experiments conducted showed that the intersection between the zero-clusters and the Structural Similarity index curves outperforms the other thresholding algorithms in the sense of the trade-off between the compression ratio and image quality.
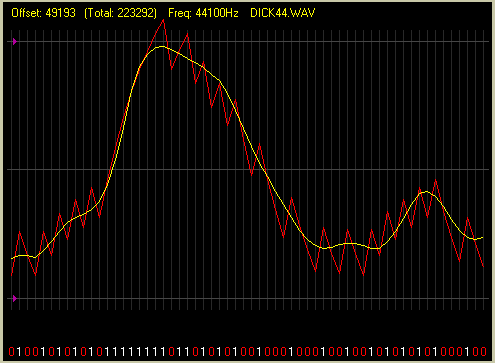
BTC and DWT for PLC
Transmission of data, images, and video over power line channels (PLC) has become the interest of not only the researchers, but also the consumers. Power line communications offers the flexibility and easy to use services, such as, fast and secure surfing on the net and powerful telephone connection using the internet that offers good speech quality. Furthermore, PLC can support high transmission rates, 200 Megabits per second (Mbps), which has met the demands for superior high speed data transmission [11].
However, to transmit huge size of multimedia data like digital video broadcasting (DVB) in real time communications is almost impossible without compression. One of the compression techniques used is the classical discrete cosine transform (DCT).
In one of the preceding studies, we presented a comparison between DCT and discrete wavelet transforms (DWT). We have compared the efficiency and accuracy of data transmission in the two methods. Results have showed that the DWT has proven to be more efficient than the DCT technique. In this paper, we will study the performance of DWT and BTC in terms of compression factor, and quality of the image, for the transmission of compressed still image using FFT-OFDM over PLC channel with additive Gaussian noise (AWGN) and impulsive noise. Also, the effect of multipath on BTC is addressed.
System design
The general information about the system design is given in this section. The more detailed explanation of the OFDM system design and principles of work can be found in the previous chapters.
OFDM System
A crucial feature of OFDM is the presence of cyclic prefix (CP) which is used to mitigate inter-symbol-interference (ISI) and inter-channel-interference (ICI) in multipath channels. Another feature of OFDM is it makes efficient use of limited bandwidth by splitting data and performing an IFFT on the symbols that are carried in multiple orthogonal subcarriers. At the receiver the opposite occurs with the receiver determining the carrier the information is modulated on and decodes the data via an FFT process.
PLC
The power line network differs than other communication channels in topology, structure, and physical properties. Numerous reflections are caused at the joints of the network topology due to impedance variations. Factors such as multipath propagation and attenuation are considered when designing PLC model. A channel model was proposed in [12] where parameters are derived from practical measurements of actual power line networks. The frequency response is given by
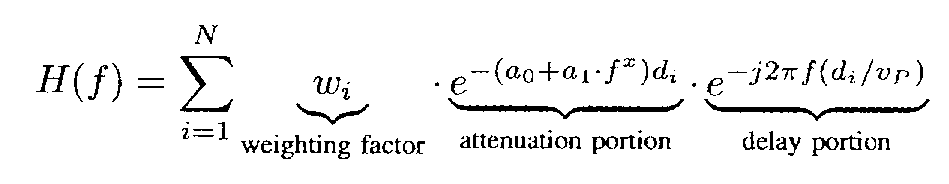
where N is the number of multipaths, wi is the product of reflections and transmission for each path i, a0 and a1 are the attenuation parameters, x is the exponent of the attenuation factor (typical values are between 0:5 and 1), di is the length of path i, and vP is the wave propagation speed which describes the echo scenario.
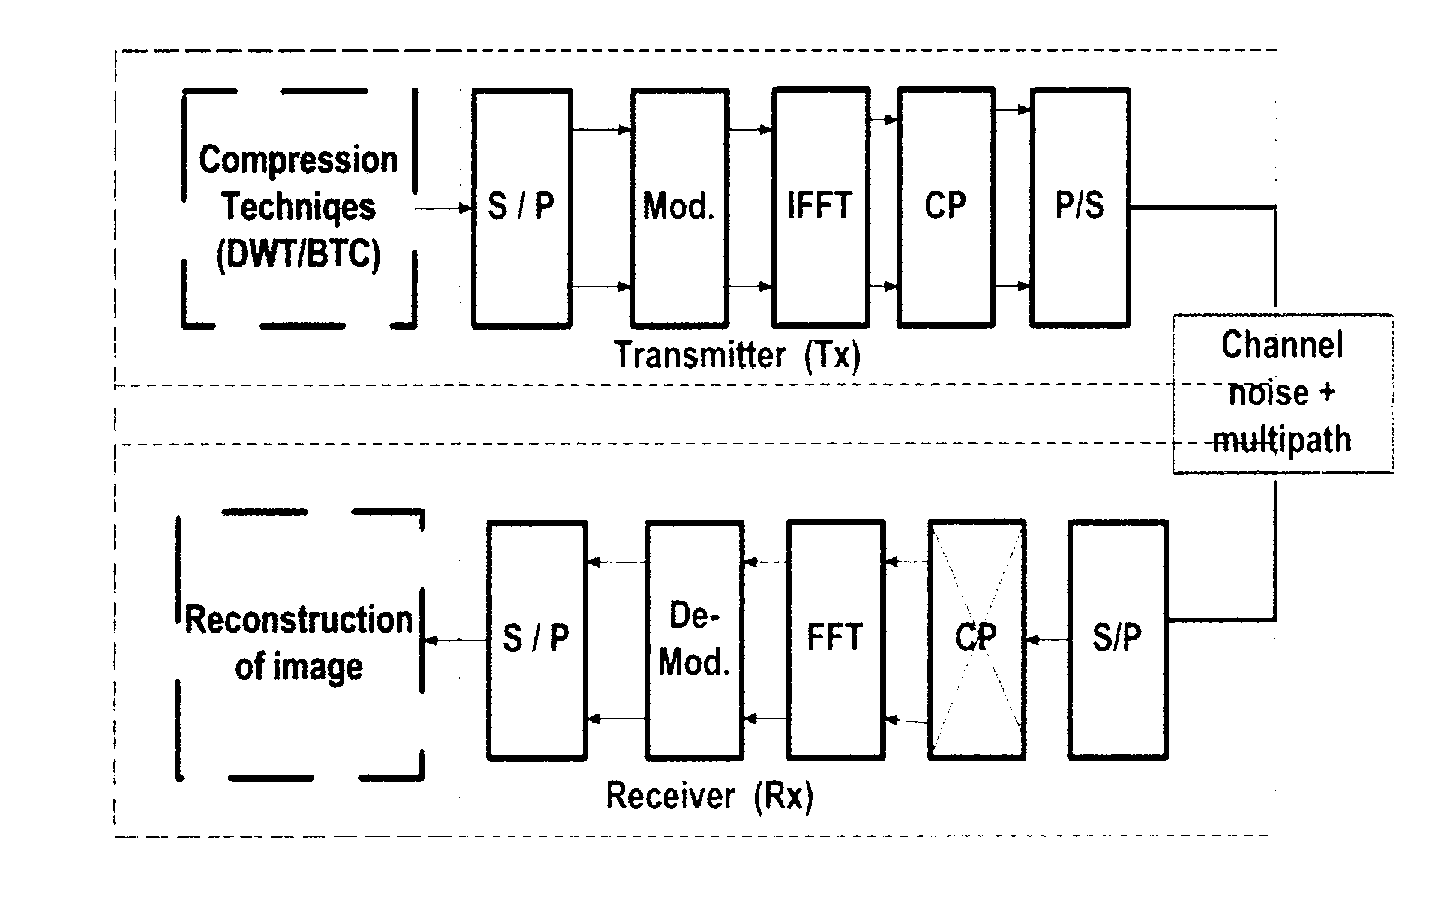
Effect of Noise
Both background noise and impulsive noise are considered when studying the effects of impulsive noise on PLC as their effects differ from that on the OFDM system in radio communications. Assuming background noise to be additive white Gaussian noise (AWGN) np with mean zero and variance
σ2n, the impulsive noise ip is given by [5]
ip = bpgp (1)
where bp is the Poisson process which is the arrival of the impulsive noise and gp is the white Gaussian process with mean zero and variance σi2. The impulsive noise occurrence is assumed to comply with Poisson distribution, while the amplitude of those impulses is modelled as being a Gaussian process.
The probability distribution Pp(t) of the Poisson process is

where λ is the number of units per second, and p is the number of arrivals in t seconds. Let Pi be defined as the total average occurrence of the impulsive noise duration in time T and is in the form of Pi = λ Tnoise (3)
where Tnoise is the average time of each impulsive noise. Derivations of this equation can be found in [5].
Performance Criteria
MATLAB simulation software was utilized to compress a 256 x 256 pixel image using two compression techniques, namely, Discrete Wavelet Transform (DWT) and Block Truncation Coding (BTC). The image was compressed before transmission in order to increase the spectral efficiency of the system. The compressed image is transmitted and received using OFDM over PLC channel under impulsive noise.
The performance criteria included compression factor (CF), quality of image, and effect of multipath on the compressed image. The CF is defined as:
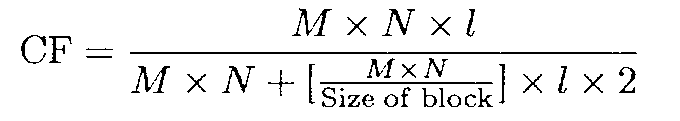
The quality of the compressed image is evaluated based on Structural Similarity Index (SSIM) for the following number of paths: 1, 4, and 15.
Our system, shown in Fig. (1), was designed using MATLAB simulation software to transmit and receive a grayscale, 256 x 256 pixel image by using the OFDM transmission algorithm over PLC.
Compression techniques
The two compression techniques are being used and compared in this experiment, namely the DWT and the BTC. Their peculiarities and special features will be compared in this chapter; we will also observe their effects on images in equal conditions.
Discrete Wavelet Transform (DWT)
Wavelets have gained widespread in signal processing for the decomposition of signals and images prior to the implementation of a compression algorithm. Wavelet transform decomposes a signal into a set of basic functions called wavelets. Through translations and dilations of a single function called a mother wavelet A (t), a signal is decomposed into many functions. The formulae for the filters h and g, also called quadrature mirror filters (QMF), are given in chapter 6.
For the decomposition and reconstruction of a signal, the QMF is used. This transformation is used to give information representing time and frequency information in the original signal.
In this study, only the low-pass coefficients are considered since the high-pass coefficients contain very little information the human eye is sensitive to. This will compress our image substantially and increase the transmission efficiency. However, the quality of the received image will be lower.
Block Truncation Coding
Standard block truncation image coding BTC, as presented by Delp and Mitchell in [16], divides the given image into blocks of fixed small size m x n (in practice m = n = 4). Then every block is compressed separately by quantization of each pixel value to one of two values v0 or v1, v0 < v1. For each block, quantization representatives are found individually using the simple heuristic: mean value and variance of pixel values should be preserved. It is equivalent to preservation of the first and the second moment. This heuristic follows from physical principles of preservation for the local average amplitude and the local average energy of image signal. The BTC of each image contain three matrixes. Bit map matrix, mean of high (1) bit and mean of low (0) bit. Fig.(2) shows the whole process of generating the BTC coefficient. The sizes of blocks that we used are 4 x 4, and 8 x 8. The equation which lets define the CF for BTC is given in the previous chapter.

Experimental results and discussion
The experiments are carried out to observe the affect of impulsive noise in PLC channel on the compressed image data. An image of size 256 x 256 was input to our system to be compressed using the two different compression techniques. The first compression method used is DWT in which the low-pass coefficients were considered. These coefficients were converted from decimal to binary using 8 bits per pixel. The compressed data is transmitted over PLC channel.
Another method used for comparison is the BTC. As it was explained in detail in one of the previous chapters, BTC work suggests that the image is divided into different size of blocks. Next, a quantiser is applied in order to reduce the number of grey levels in each block. At the same time, the mean and standard deviation stay the same. For each block, the bit-map matrix, the lower mean, and the higher mean are calculated and then all the blocks coefficients are concatenated as one vector, which is transmitted over the PLC channel.
The effect of multipath on the compression methods used is studied and compared. As the number of paths increases, the quality of image is degraded. This is obvious for both compression techniques as shown in fig. (3). This is due to many factors such as the length of links and various reflections in the PLC channel at branching points.
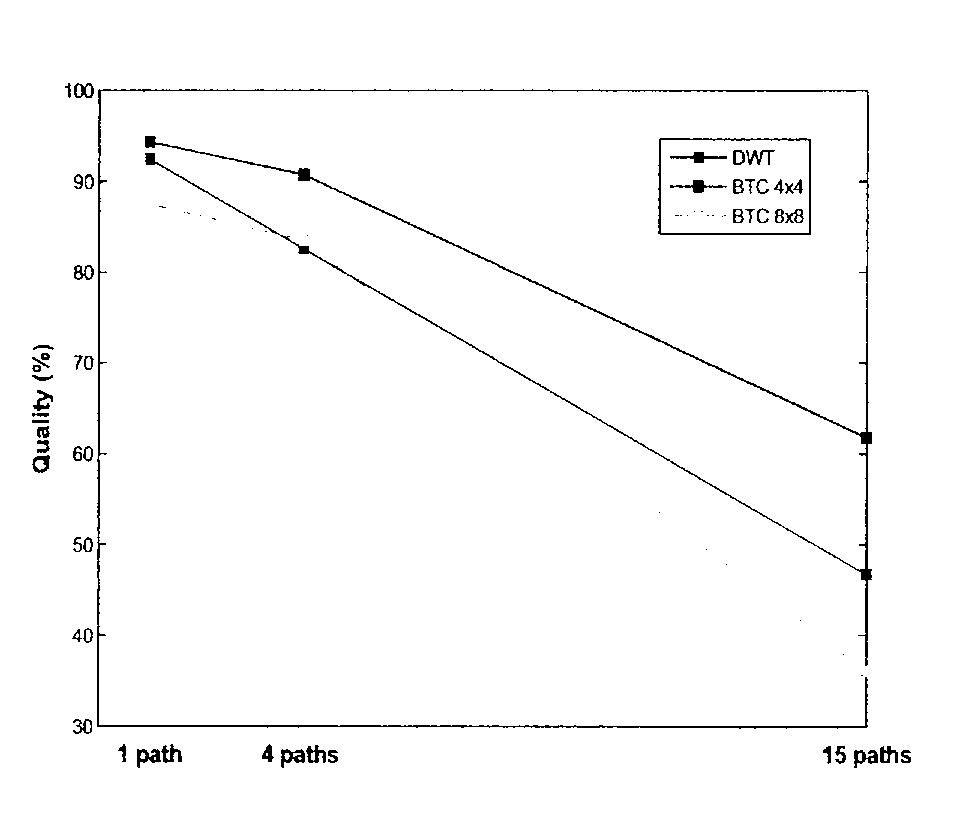
Table I illustrates a summary of the obtained results in terms of quality assessment (QA) and compression factor (CF). The quality of image was evaluated based on structural similarity index (SSIM) which was proven in previous research is in conformation to the human visual system (HVS). It can be observed from Table I that the CF and QA for BTC are higher than that of DWT. This due to the fact, in BTC we process the image in spatial domain and extract the coefficients locally while in DWT the coefficients are extracted globally.
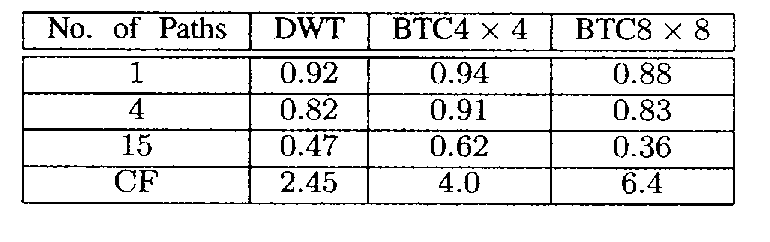
Fig.(4) (a-i) shows the reconstructed images at the receiver using DWT and BTC (4 x 4 and 8 x 8) for different paths. As can be noticed from fig.(4), the quality of image using BTC method is higher than the DWT method. In addition to the high quality of image, BTC has a higher CF compared to DWT.
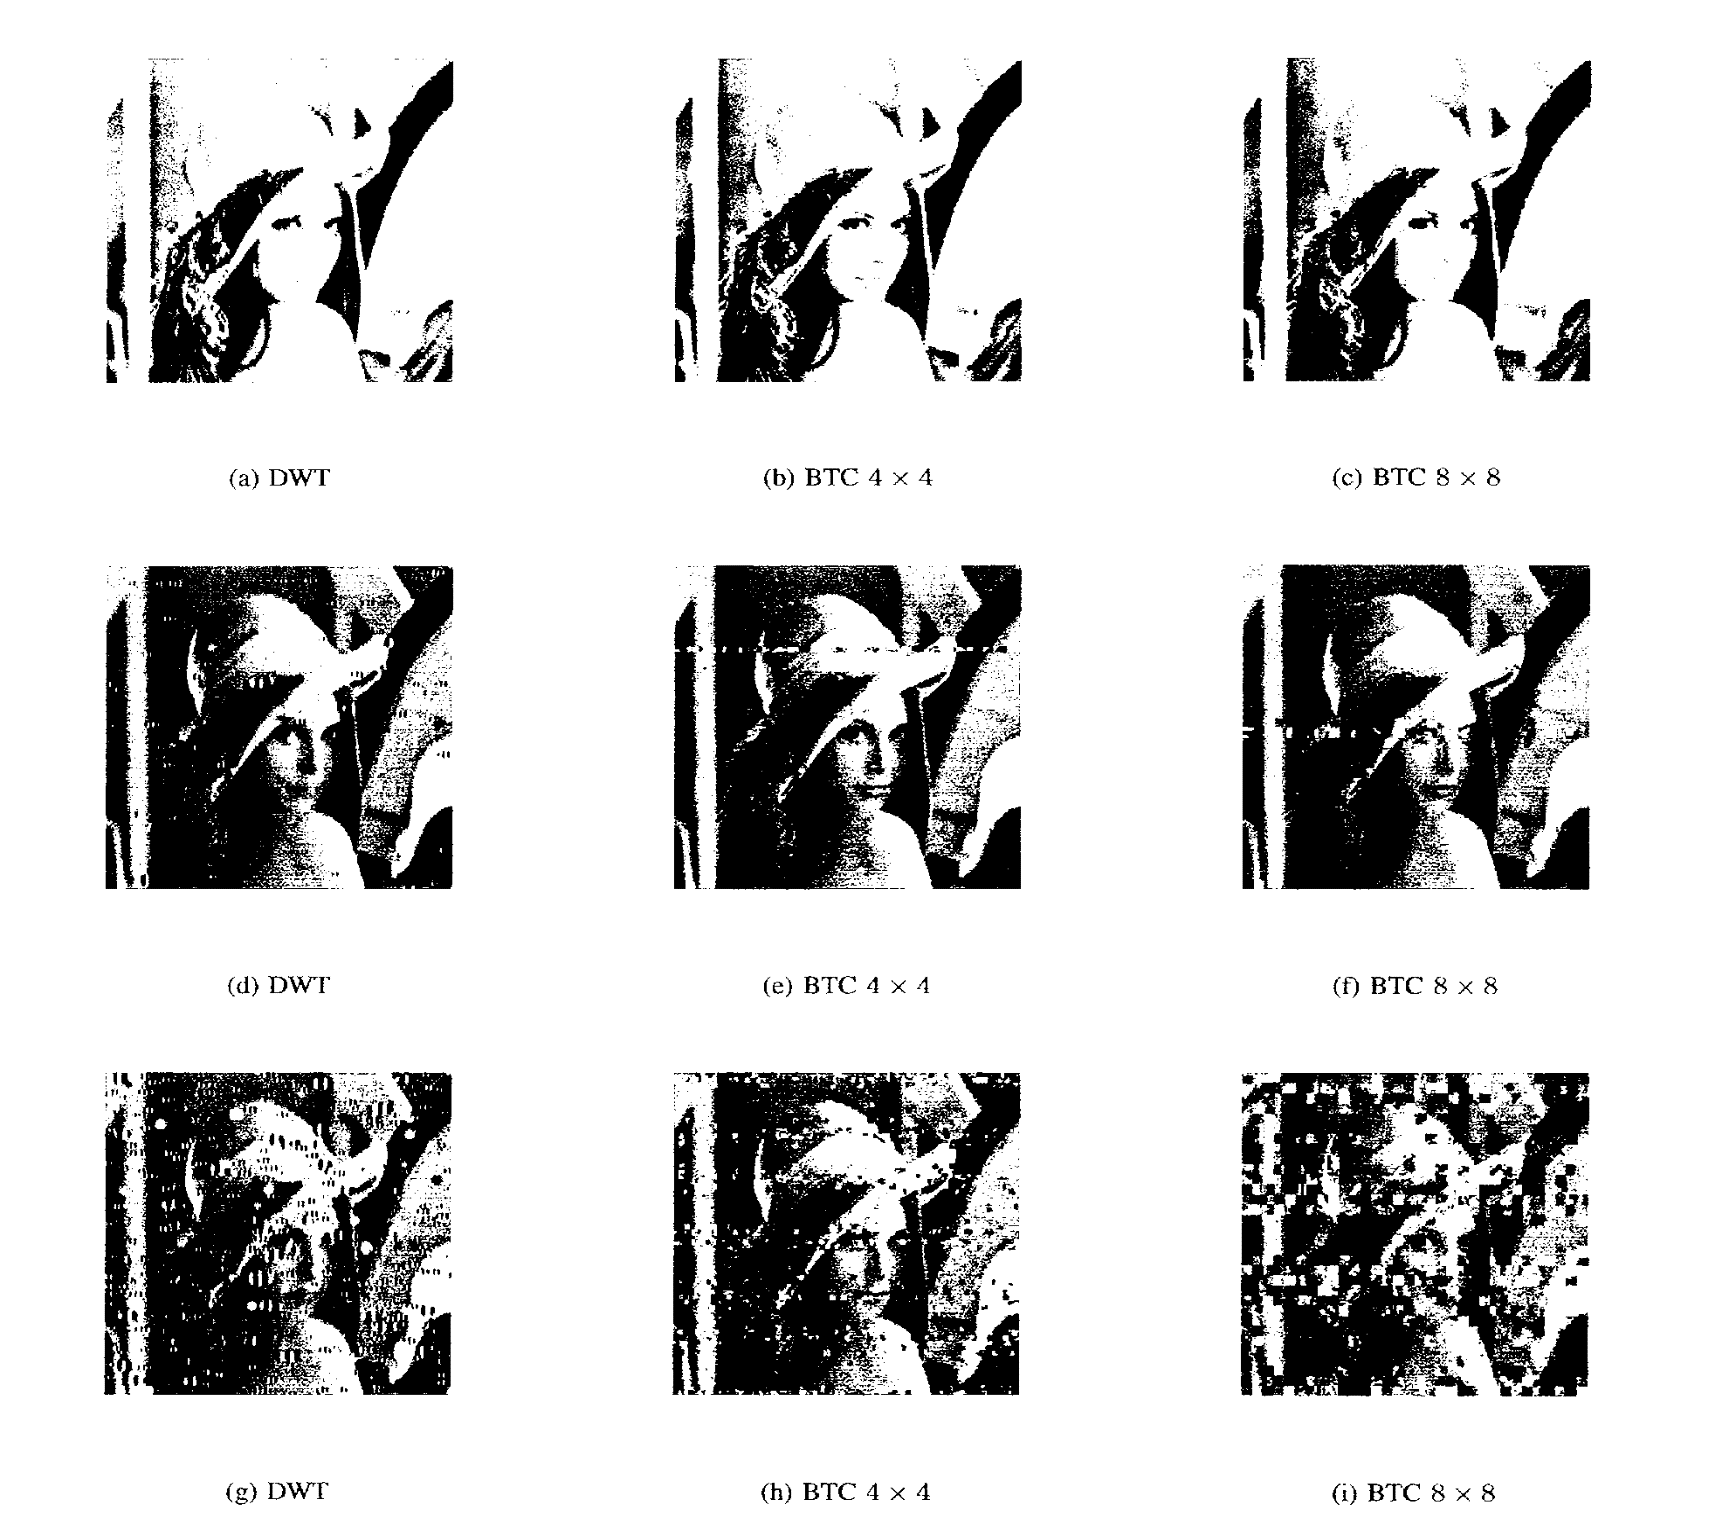
Summary
In this chapter, the effects of multipath and impulsive noise on a compressed image using two different compression techniques were investigated. We applied these techniques for a PLC channel. A comparison between BTC compression method and DWT compression method was carried out in terms of compression factor, and quality of image. Overall, the experiments conducted showed that both compression methods were affected by impulsive noise and number of paths (i.e. degradation in the quality of image). However, the effect of impulsive noise on DWT was higher than BTC, resulting in a lower quality of the reconstructed image. In terms of compression factor alone, BTC performed better than DWT, giving high compression factors while maintaining the quality of image.
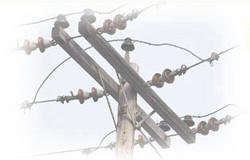
PLC performance under different conditions
In the telecommunications industry, the use of existing power lines has drawn the attention of many researchers in the recent years. PLC has the potential to deliver the broadband services such as fast internet access. This is due to the advantage of the widespread of power lines and power outlets, which mean a universal coverage.
PLC suffers different challenges, such as impedance variation, attenuation, channel transfer function varying widely from time to time, and noise in the system. One of the most serious problems of the PLC as a communication channel is the affluence of impulsive noise. Impulsive noise is characterized by very short duration (hence, broadband noise) with random occurrence. This can affect data transmission by causing bit or burst errors [5]. According to [35], a model was proposed to model impulsive noise based on a partitioned Markov chain. Based on this model, the arrival rate and power spectral density (PSD) of impulsive noise were quantified. It has been found that the arrival of impulsive noise follows Poisson distribution.
One of the properties of impulsive noise is the time-variant behavior which introduces considerable burst errors that will affect consecutive bits especially in high-speed data transmission [35]. The two types of impulsive noise, namely, asynchronous impulsive noise and periodic impulsive noise synchronous to the mains frequency will be briefly presented and compared in this chapter. They are used in order to compare the BER performance of the channel.
Another considerable challenge for PLC is the mulitpath effect. A multipath model in [12] and [40] is proposed where additional paths (echoes) are considered. This model will be briefly presented in Section III of this paper. Consequently, we were motivated to transmit a compressed image using OFDM over power line channel under hostile environment. One of the advantage of OFDM over single carrier is that the effect of impulsive noise in a channel is spread over multiple symbols due to discrete Fourier transform (DFT) algorithm. Also, under multipath effect, the long symbol duration time permits OFDM to perform better than single carrier [5].
To assess the image quality at the receiver end, Structural Similarity Index (SSIM) is utilized which was proved to be highly conformed with human visual evaluation compared to Mean Square Error (MSE) [43]. In this paper, the effect of number of paths and the length of link of the PLC channel on the image quality is investigated. The received image quality is evaluated based on the SSIM algorithm.
The OFDM and PLC system models used in this experiment are identical to those introduced in previous chapters.
System model
Generally, power lines have variable impedance at different points on the grid or transmission lines. Broadband PLC are considered as mutlipath channels. In addition, there will be frequency selective fading since the transmission signals on the power line yield their own reflected signals at the impedance mismatching points.
OFDM is a very good candidate for modulation scheme for broadband PLC. A crucial feature of OFDM is its cyclic prefix which is used to mitigate the inter-symbol-interference (ISI) and inter-channel interference (ICI) which can be very hazardous for successful system performance. At the receiver, a specific instant within the cyclic prefix is selected as the sampling starting point. The only necessary condition is that this prefix should be less than the guard interval. This will allow avoiding the ISI.
Transmitter (Tx)
MATLAB simulation software was utilized to compress a 256 x 256 pixel image using Dicrete Wavelet Transform (DWT), as shown in Fig.(1). The Discrete Wavelet Transform was used for the compression of the image before transmission in order to increase the spectral efficiency of the system. The compressed image is transmitted and received using OFDM over PLC channel.
A grayscale image of 256 x 256 pixels is input into our system, a Discrete Wavelet Transform (DWT) was then performed on our image to extract the detail coefficients for our image. To make transmission more efficient we then passed these coefficients through a filter block to extract only the low pass coefficients and remove all the high pass detail coefficients. These coefficients were selected as they contain the image component the human eye is most sensitive to [21].
Following these low pass coefficients being extracted, scalar quantization is applied and the result was converted from decimal to an 8 bit binary string in preparation for modulation. The modulation scheme chosen for our system was OFDM transmission implemented with 16-QAM. This involved 16QAM modulation of a parallel stream of binary data and then an IFFT process performed on the resulting data. This data was then transmitted over a PLC channel with AWGN and impulsive noise. It is assumed that the transmission is achieved in baseband to avoid long simulation time.
Receiver (Rx)
At the receiver a version of the sent data is received but corrupted with channel distortion, AWGN, and impulsive noise. The first process used to demodulate the signal is to rearrange the received bits into parallel form and perform an FFT on the data. This data then needs to pass through an equalizer (we assumed perfect channel estimation at the receiver) to remove as much of the channel distortion as possible and determine the most likely 16-QAM symbols received. These symbols are then demodulated, converted back to a serial stream before being converted back to decimal and finally have an inverse wavelet transform performed. The resulting data was then compared and the quality of the image was calculated.
Multipath for PLC channels
There are many effects influencing transmission of data over power line networks such as multipath signal propagation and cable losses. Within a network topology there are impedance variations at the joints of the network components and the connected equipments causing numerious reflections. These numerous reflections must be considered when analyzing the path described by the signal in the network. Also, additional paths must be taken into account due to the fact that signal propagation does not only take place along a direct lineof- sight path between the transmitter and the receiver. As a result, the channel model presents a multipath scenario with frequency selective fading [12].
A simple example in [5] is analyzed to study multipath signal propagation. Let the weighting factor wi represents the product of reflections and transmission for each path i. wi should be less than or equal to one due to the fact that the resulting impedance of a load connected in parallel to two or more cables is lower than the feeding cable impedance.
The delay time Ti of a path is
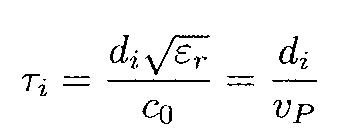
where εr is the dielectric constant of the insulating material, co is the speed of light, di is the length of path i, and vP is the wave propagation speed on the transmission line.
The attenuation factor α(f) can be proportional to √f or to f, depending on either the material and geometry parameters being dominant. Thus, an approximating formula for the attenuation factor α is found in the form α(f) = a0 + a1 ∙ fk (2)
where a0 and a1 are the attenuation parameters, and k is the exponent of the attenuation factor (typical values for such factor usually are between 0:5 and 1). These parameters are derived from measured transfer functions because it is generally impossible to attain all the necessary cable and geometry data for real networks. Derivations of measured frequency responses can be found in [12].
The attenuation A(f; d) of a power line cable is caused by reflections and cable losses which increases with length and frequency and can be found in the form
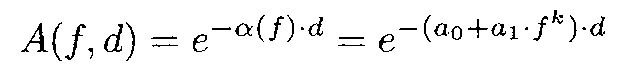
Combining multipath propagation and attenuation, the frequency response is given by
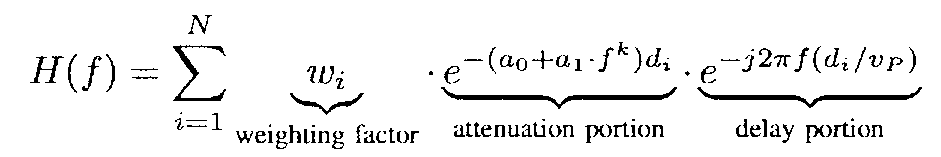
This parametric model is efficient for frequency range from 500 kHz and 20 MHz by a small set of parameters which can be derived from measured frequency responses.
Experimental results and discussion
MATLAB is utilized to conduct the following simulations. These simulations are carried out using one hundred realizations. It should be noted that in the multipath channel, SNR is defined as ratio of average QAM-symbol energy over noise-energy per QAM-symbol. Moreover, the power due to cyclic prefix is ignored since it has no overall effect on the communication system performance.
Effects of Number of Paths
With only one path, one can define simple attenuation profiles. Likewise, to analyze the performance of a simulative PLC-system, a reasonable number of paths can be specified. Hence, the number of paths, N, controls the precision of the model and enables it to be used for different applications [12].
In order to perceive the effect of number of paths, a fourpath and a fifteen-path models are examined. The attenuation parameters used for both models are: k = 1, a0 = 0 m-1, a1 = 7.8 x 10 –10s/m. The other parameters set are listed in Table I and Table II.
Table I: Parameters of the 4-Path Model.
When the number of paths reduced from fifteen to four, the quality of image was higher (> 80%) as shown in fig.(2), (a-b). Consequently, when transmitting a compressed image over a larger number of paths, it exhibits more noise, which in return affects its quality as expected.
Table II: Parameters of the 15-Path Model.
Length of Link
Every link in a powerline has its own attenuation profile depending on the length, layout, and cable types. In addition, the influence of multipath fading due to reflections at branching point varies the attenuation profile of the link [12].
The attenuation parameters for short-distance link and long distance link are considered in order to observe their effect on the quality of image.
Short-Distance Link
Short-distance links are 100.200 m. For our study, we will use attenuation profile of a 150 m powerline link. The attenuation parameters used are:
k = 0:7,
a0 =.2.03 x 10–3m–1,
a1 = 3.75 x 10⁻⁷s/m
w1 = 1
N = 1 path [31].
Long-Distance Link
Long-distance links are typically > 300 m and suffer much higher attenuation, mainly caused by higher cable losses due to length and many branches. We will use attenuation profile of a 330 m powerline link. The attenuation parameters used are:
k = 1,
a0 = 6.5 x 10⁻³ m-1
a1 = 2.46 x 10⁻⁹s/m
w1 = 1 and
N = 1 path [31].
Fig.(3a) clearly shows a higher quality of image (> 85%) using short-distance link parameters compared to the quality of image shown in fig.(3b) when using long-distance link parameters. This indicates that it is preferable to transmit an image through short-distance link as the attenuation is lower due to lower cable losses.
Table III illustrates a comparison among different parameters of the PLC channel based on the number of paths, distance, and the quality of image (using SSIM index). It should be noted that weighting factors wi and attenuation parameters depend on length, layout, cable types, and reflections at branching points of the PLC channel as mentioned earlier.
Table III: A comparison among different parameters of the PLC channel.
According to this comparison, one can notice a big difference in the SSIM index values with regards to N = 1 and distance. It is evident from fig.(3b) that with long-distance link the quality of image is lower due to the high effect of noise.
On the other hand, increasing the number of paths to four, while keeping distance short, maintains a very good quality image compared to the fifteen-path model.
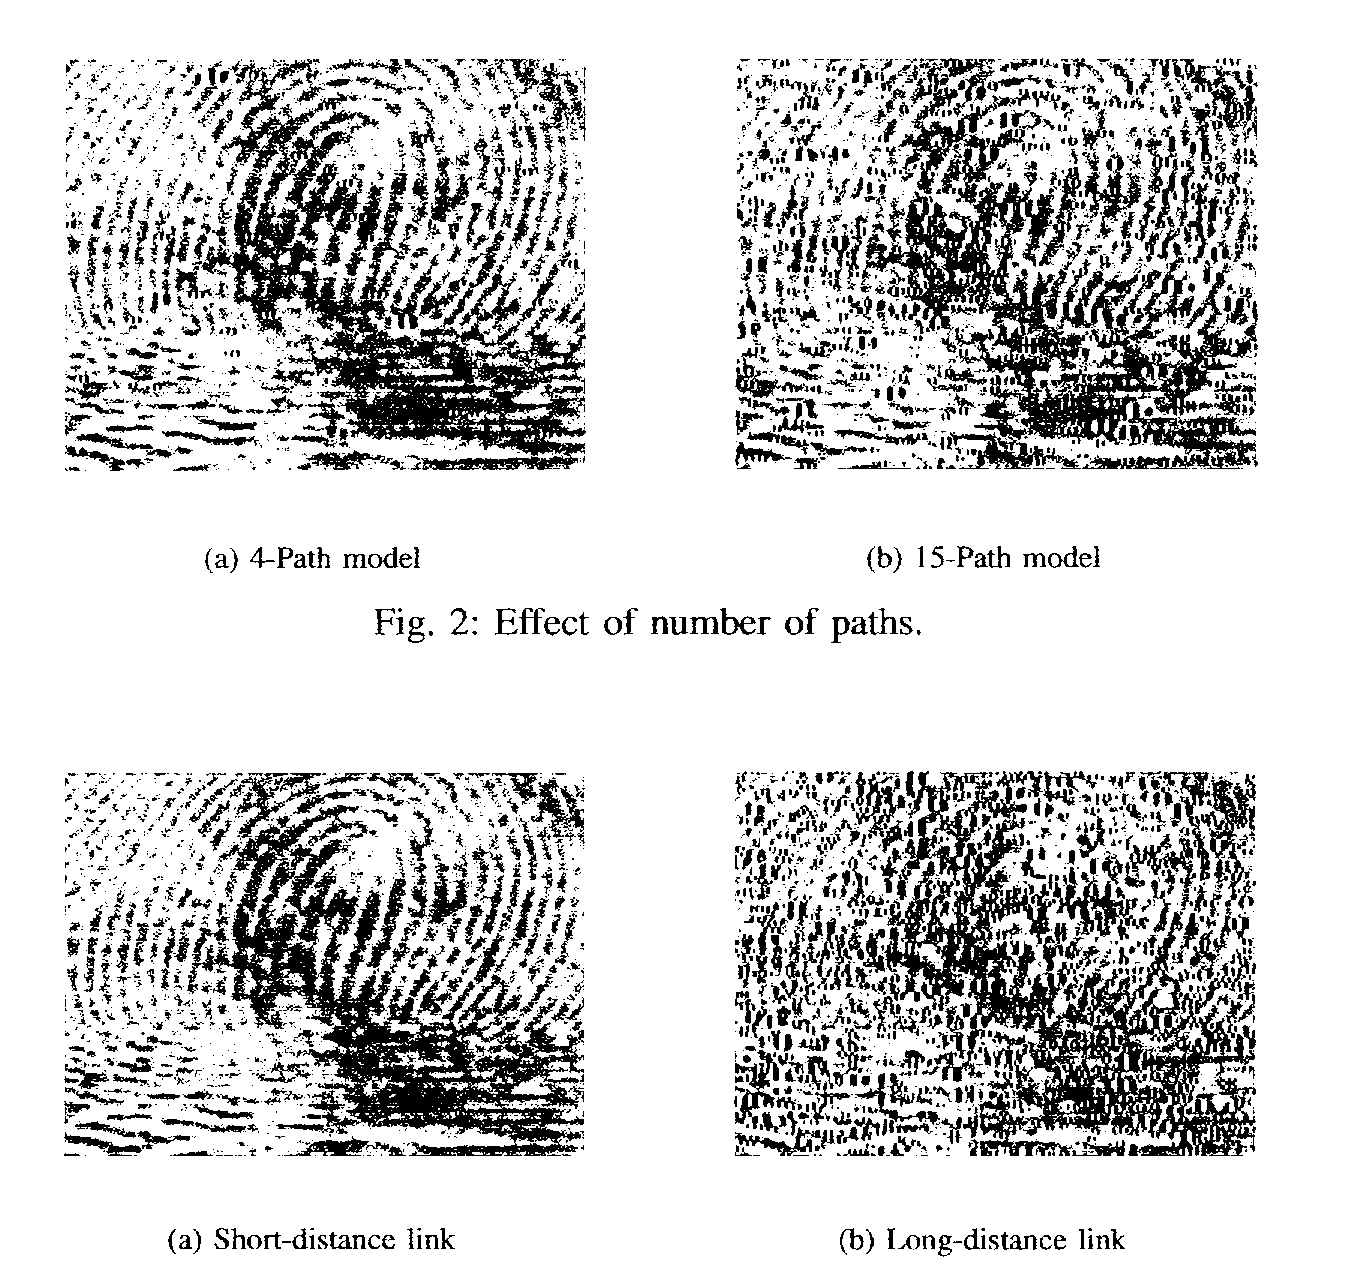
Effects of noise
As explained in the previous chapters, noise in the power line channel is categorized into five types. Colored background noise, narrowband noise, and periodic impulsive noise asynchronous to the mains frequency are summarized as background noise. The other kinds, which are the periodic impulsive noise synchronous to the mains frequency and asynchronous impulsive noise are classified as impulsive noise [32]. Both background noise and impulsive noise are considered when studying the effects of impulsive noise on PLC as their effects differ from that on the OFDM system in radio communications. In this study, we pay more attention to the both kinds of the impulsive type of noise as they occur in power line communications most frequently. Following is the detailed explanation of the noises’ peculiarities.
Asynchronous Impulsive Noise
This type of noise is caused by switching transients in the network with random occurrence that last for a very small fraction of time [14]. When studying the effects of impulsive noise on PLC, both background noise and impulsive noise are considered. Their effects differ on PLC from that on the OFDM system in radio communications. The impulsive noise occurrence is assumed to comply with Poisson distribution, while the amplitude of those impulses is modelled as being a Gaussian process. Fig. (2) shows impulsive noise samples as well as the background AWGN.
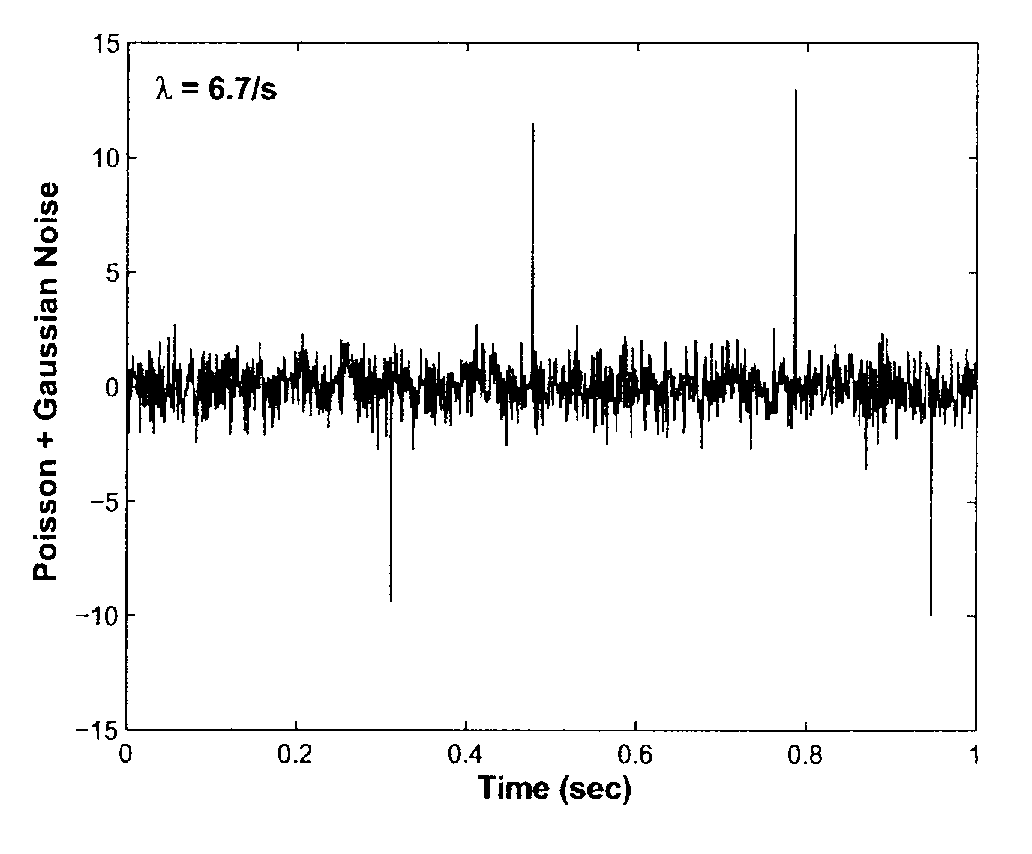
The probability distribution Pp(t) of the Poisson process is
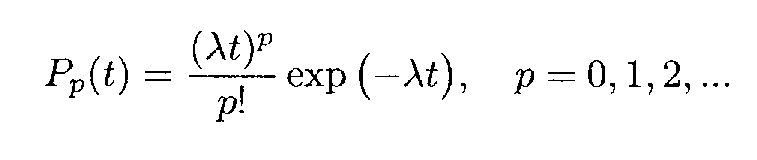
where p is the number of arrivals in t seconds. Let Pi be defined as the total average occurrence of the impulsive noise duration in time T and is in the form of
where Tnoise is the average time of each impulsive noise. Derivations of this equation can be found in [5].
Periodic Impulsive Noise Synchronous to the Mains Frequency
This type of noise follows a constant repetition pattern, with a rate of 50 or 100 Hz. This means they are caused by power supplies that work synchronously with the mains cycle, such as switching of rectifier diodes [35].
From the power spectral density (PSD), the period of this noise can be calculated, given that the spectral lines are equally spaced and are separated by the sweep time rather than the switching frequency. Therefore, to determine the period of this noise with a switching periodic noise of frequency equal to 50 Hz, and sampling time is 5 ms, it would hit every 1=50 = 20 ms. This means one sample from every group of four consecutive ones [16]. The pattern of periodic impulsive noise synchronous to the mains frequency (50 Hz) is shown in fig.(3).
Experimental results and discussion
Discrete Wavelet Transform (DWT) was employed for the compression of a gray scale image of 256 x 256 before transmission in order to increase the efficiency of this system. The modulation scheme chosen for our system was 16-QAM. In addition, the numbers of carriers M used are 32 and 128 respectively. Four multipaths have been assumed. MATLAB is utilized to conduct the following simulations.
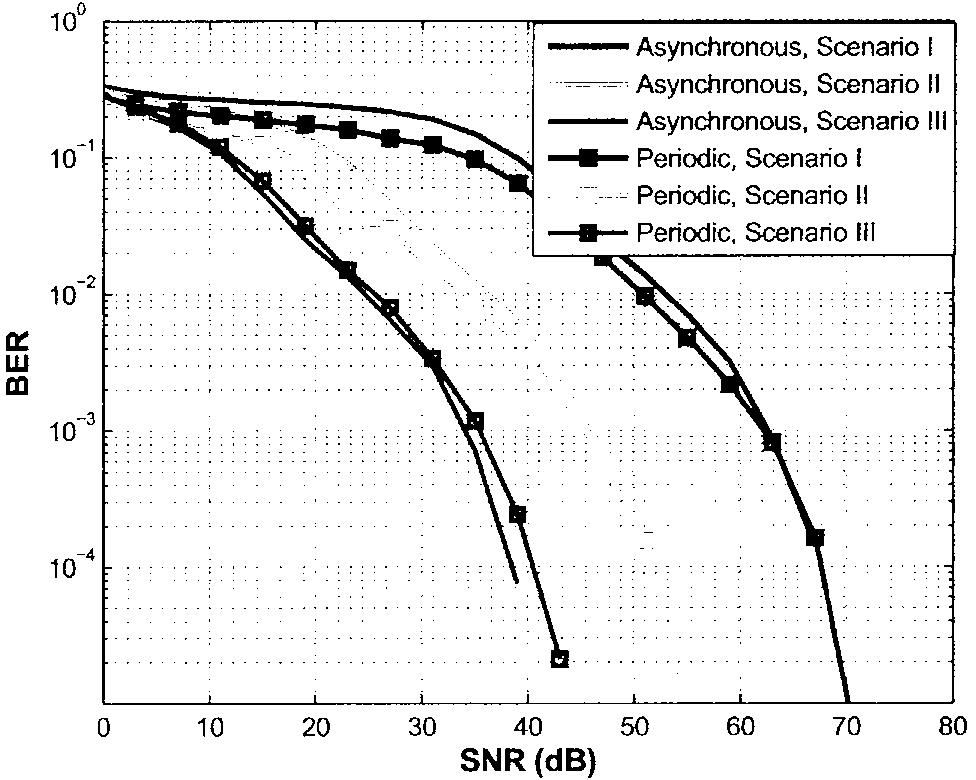
A comparison is performed between periodic impulsive noise synchronous to the mains frequency and the asynchronous impulsive noise in different impulsive noise environments. The first scenario is named ”heavily disturbed” and it was measured during the evening hours in a transformer substation in an industrial area. The second scenario is named ”moderately disturbed” and was recorded in a transformer substation in a residential area with detached and terraced houses.
The third scenario is named ”weakly disturbed” and was recorded during nighttime in an apartment located in a large building [35]. The parameter set are obtained from [5] and are illustrated in Table I. The reciprocal of the arrival rate is the inter-arrival time of the impulsive noise (IAT). Fig.(4) and fig.(5) shows the BER performance comparison between periodic impulsive noise and asynchronous impulsive noise under the effects of three impulsive noise scenarios with M = 32 and M = 128, respectively. In general, the BER performance for the two types of noise is comparable.
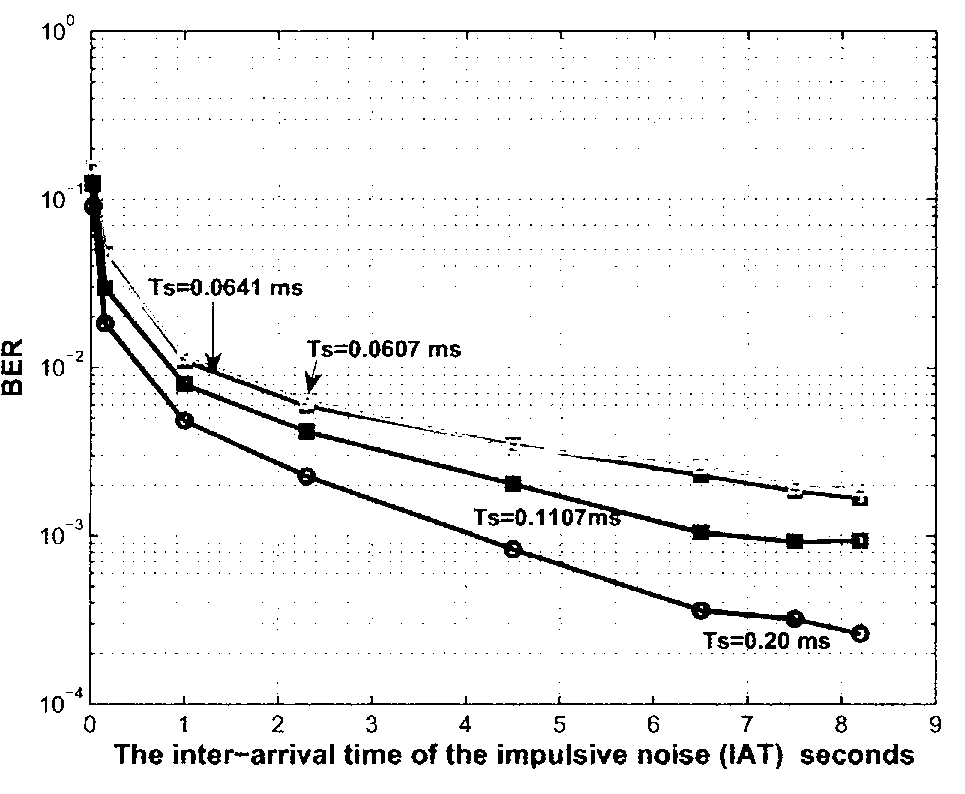
However, the periodic impulsive noise performed slightly better than the asynchronous impulsive noise over all SNRs in all the three scenarios. For various average time of each impulsive noise, the BER performance was compared at specific SNR value (SNR=35 dB). It can be seen in fig. (6) that as the inter-arrival time of the impulsive noise (IAT) increases, the BER decreases. This is true as the average time of each impulsive noise increases. In addition, the quality of image was evaluated in evidence to the above findings. Table II illustrates the results.

Summary
In this chapter we investigated the effects of number of paths and length of link on the quality of image transmitted over noisy PLC channel using OFDM. The PLC channel is assumed to be subjected to Gaussian and impulsive noises. The image quality is assessed according to the Structural Similarity Index (SSIM) algorithm which has proved its proximity to human vision system. Simulations show that the image quality is highly affected by the interaction of the distance of PLC channel link and the number of multipath reflections. Different PLC channel parameters are used.
Moreover, a comparison is carried between two types of impulsive noise, namely, asynchronous impulsive noise and periodic impulsive noise synchronous to the mains frequency which are present in PLC channels. Three impulsive noise scenarios were considered. The experiments conducted showed that both types of noise performed similarly in the three impulsive noise scenarios. At specific values for average time of each impulsive noise and SNR, the BER performance increased with the increase in the IAT.
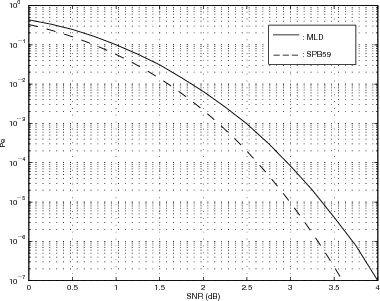
BCH coding scheme for PLC
It is a well-known fact that PLC is treated as an effective means of communication due to its multiple benefits, such as ease of installation (i.e. no need to change the infrastructure of the system which could be time consuming and costly). Also, the widespread of plugs makes it flexible to use for different purposes [55]. However, the performance of the PLC system is degraded with several drawbacks in particular impulsive noise.
To obtain a satisfactory performance of the system, coded OFDM systems like RS (Reed-Solomon), convolutional codes, and turbo codes are adopted. Orthogonal Frequency Division Multiplexing (OFDM) is a good candidate for PLC and is used for high data rate transmission. This is due to its robustness against frequency selective multi-path channels and its error correction ability of channel codes [15]. Consequently, we were motivated to implement Bose-Chaudhuri-Hocquenghen (BCH) coding to examine its effect on the performance of PLC channel in the presence of AWGN and impulsive noise.
BCH codes and RS codes are related and their decoding algorithms are quite similar. In previous researches it was found that with similar rate and codeword length, BCH codes can achieve around additional 0:6 dB coding gain over AWGN channel compared to RS codes [41]. RS codes are mainly used in optical communication. While in the second generation Digital Video Broadcasting (DVB-S2) Standard from the European Telecommunications Standard Institute (ETSI), long BCH codes of block length 32400-bit or longer are used as the outer forward error-correcting code [42].
In this paper, a comparison of the performance of PLC channel with AWGN and impulsive noise without coding and with BCH coding is evaluated. The performance criteria include quality of image of various BCH encoder sizes in different impulsive environments.
System design
As it was explained earlier in the thesis, the cyclic prefix (CP) in OFDM prevents the system from inter-symbol-interference (ISI) and inter-channel-interference (ICI) in multipath channels. In addition, OFDM is capable of making efficient use of limited bandwidth by splitting data and performing an IFFT on the symbols that are carried in multiple orthogonal subcarriers.
The modulation scheme chosen for our system is OFDM transmission implemented with 16-QAM. This involved 16- QAM modulation of a parallel stream of binary data and then an IFFT process performed on the resulting data. This data was then transmitted over a PLC channel with AWGN and impulsive noise. It is assumed that the transmission is achieved in baseband to avoid long simulation time.
The design of the OFDM system and the PLC channel s identical to that illustrated in the previous experiments. In our system shown in Fig.(1), block truncation coding (BTC) is used for compressing a grayscale image of size 256 x 256 to increase the efficiency of our transmission system.
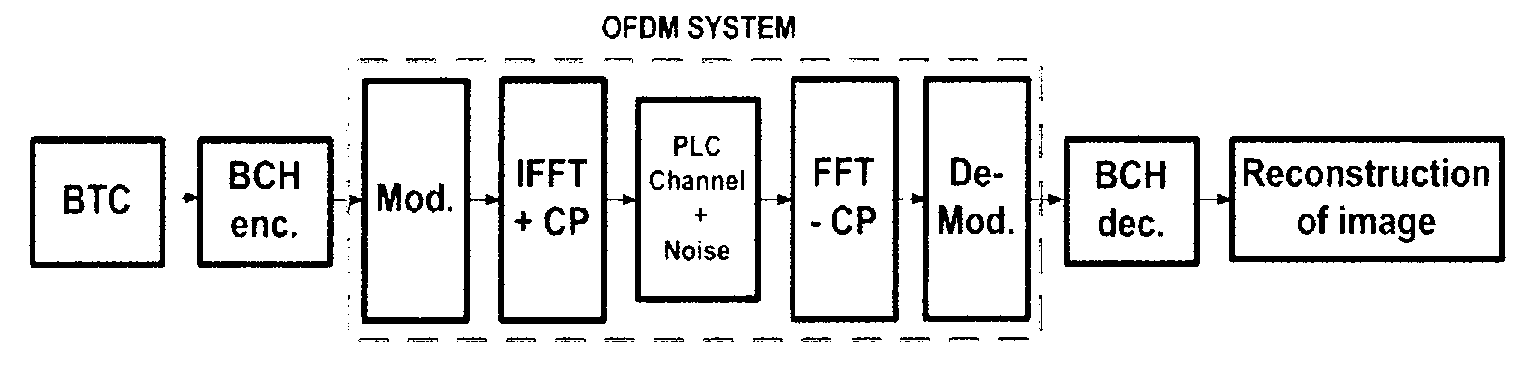
Bose – Chaudhuri – Hocquenghen (BCH) Coding
Bose – Chaudhuri – Hocquenghen (BCH) codes are becoming very popular in various fields such as technology design, coding theory, theoretical computer science, and digital communication. Their discovery was made on the basis of the well-known Reed-Solomon codes. These cyclic codes are aimed at correcting the errors and have a number of advantages compared to other kinds of error-correcting codes. First of all, BCH codes allow working with various error thresholds, code rates, and with blocks of different sizes. In addition, the cyclic code property can be easily verified. Such flexibility suggests that there is no standard for the code form; this simplifies the work considerably.
Another important feature which makes BCH code convenient in use is the simplicity of its decoding process. Some scientists [41] divide the process of BHC decoding in several stages. Firstly, the 2t syndrome values for the received vector have to be calculated. Secondly, the error rate polynomial has to be defined. Next, by calculating its roots, the error location has to be defined. Finally, the error values can be calculated in the definite error positions.
Besides the numerous beneficial properties, BCH codes’ performance can be degraded considerably in some cases. For example, at very high and very low rates the performance of BCH codes over the Gaussian Channel is much worse.
The opportunity to design the BCH codes with a large selection of block lengths, code rates, alphabet sizes, and error-correcting capability allows using the code for multiple error correction. Therefore, they can be considered as a generalization of the Hamming codes. Compared to all other block codes, BCH performs better at block lengths of a few hundred, with the same block length and code rate.
An existing binary BCH code [n; k] has the following properties:
- Code length n=2m-1 where 3 ≤ m ≤16
- Number of parity bits n-k ≤ mt
- Minimum Hamming distance dmin ≥ 2t+1
- Error-correction capability t error in a code vector
The design method for correcting at least t errors of a BCH code over GF(q) of length n is as follows:
- Select a minimal positive integer m, to find a primitive nth root of unity α in a field GF (qm).
- For some non-negative integer b, select (δ -1)=2t consecutive powers of α.
- Take the last common multiple of appropriate minimal polynomials for the selected powers of α with respect to GF (q).
In this study we consider BCH encoder size of [31; 16] and [63; 16] with a corresponding error-correction capability of 3 and 11 respectively [56].
Experimental results and discussion
Matlab is utilized to conduct the following simulations. Block truncation coding is employed to compress a grayscale image of 256 x 256 followed by BCH coding to improve the performance of the PLC system. Two different sizes of BCH encoders are used to compare their effect on the quality of the image. Table I shows a summary of the parameters used in this study. In addition, three impulsive scenarios are
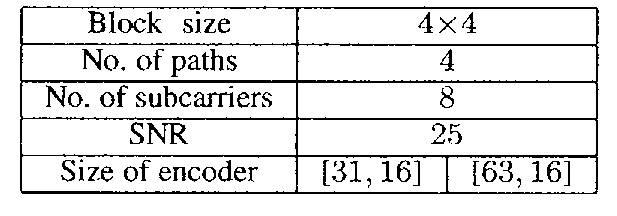
Size of encoder [31; 16] [63; 16] considered in this study to evaluate the performance of the system with and without coding. The first scenario is named as ”heavily disturbed” and it was measured during the evening hours in a transformer substation in an industrial area. The second scenario is named ”moderately disturbed” and was recorded in a transformer substation in a residential area with detached and terraced houses. The third scenario is named ”weakly disturbed” and was recorded during nighttime in an apartment located in a large building. The parameter set are obtained from [5] and are illustrated in Table II. The reciprocal of the arrival rate is the inter-arrival time of the impulsive noise (IAT).
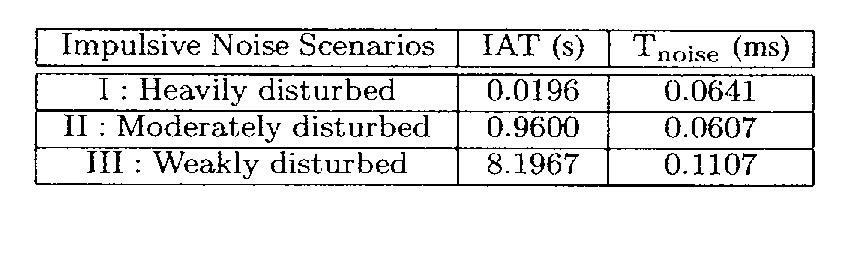
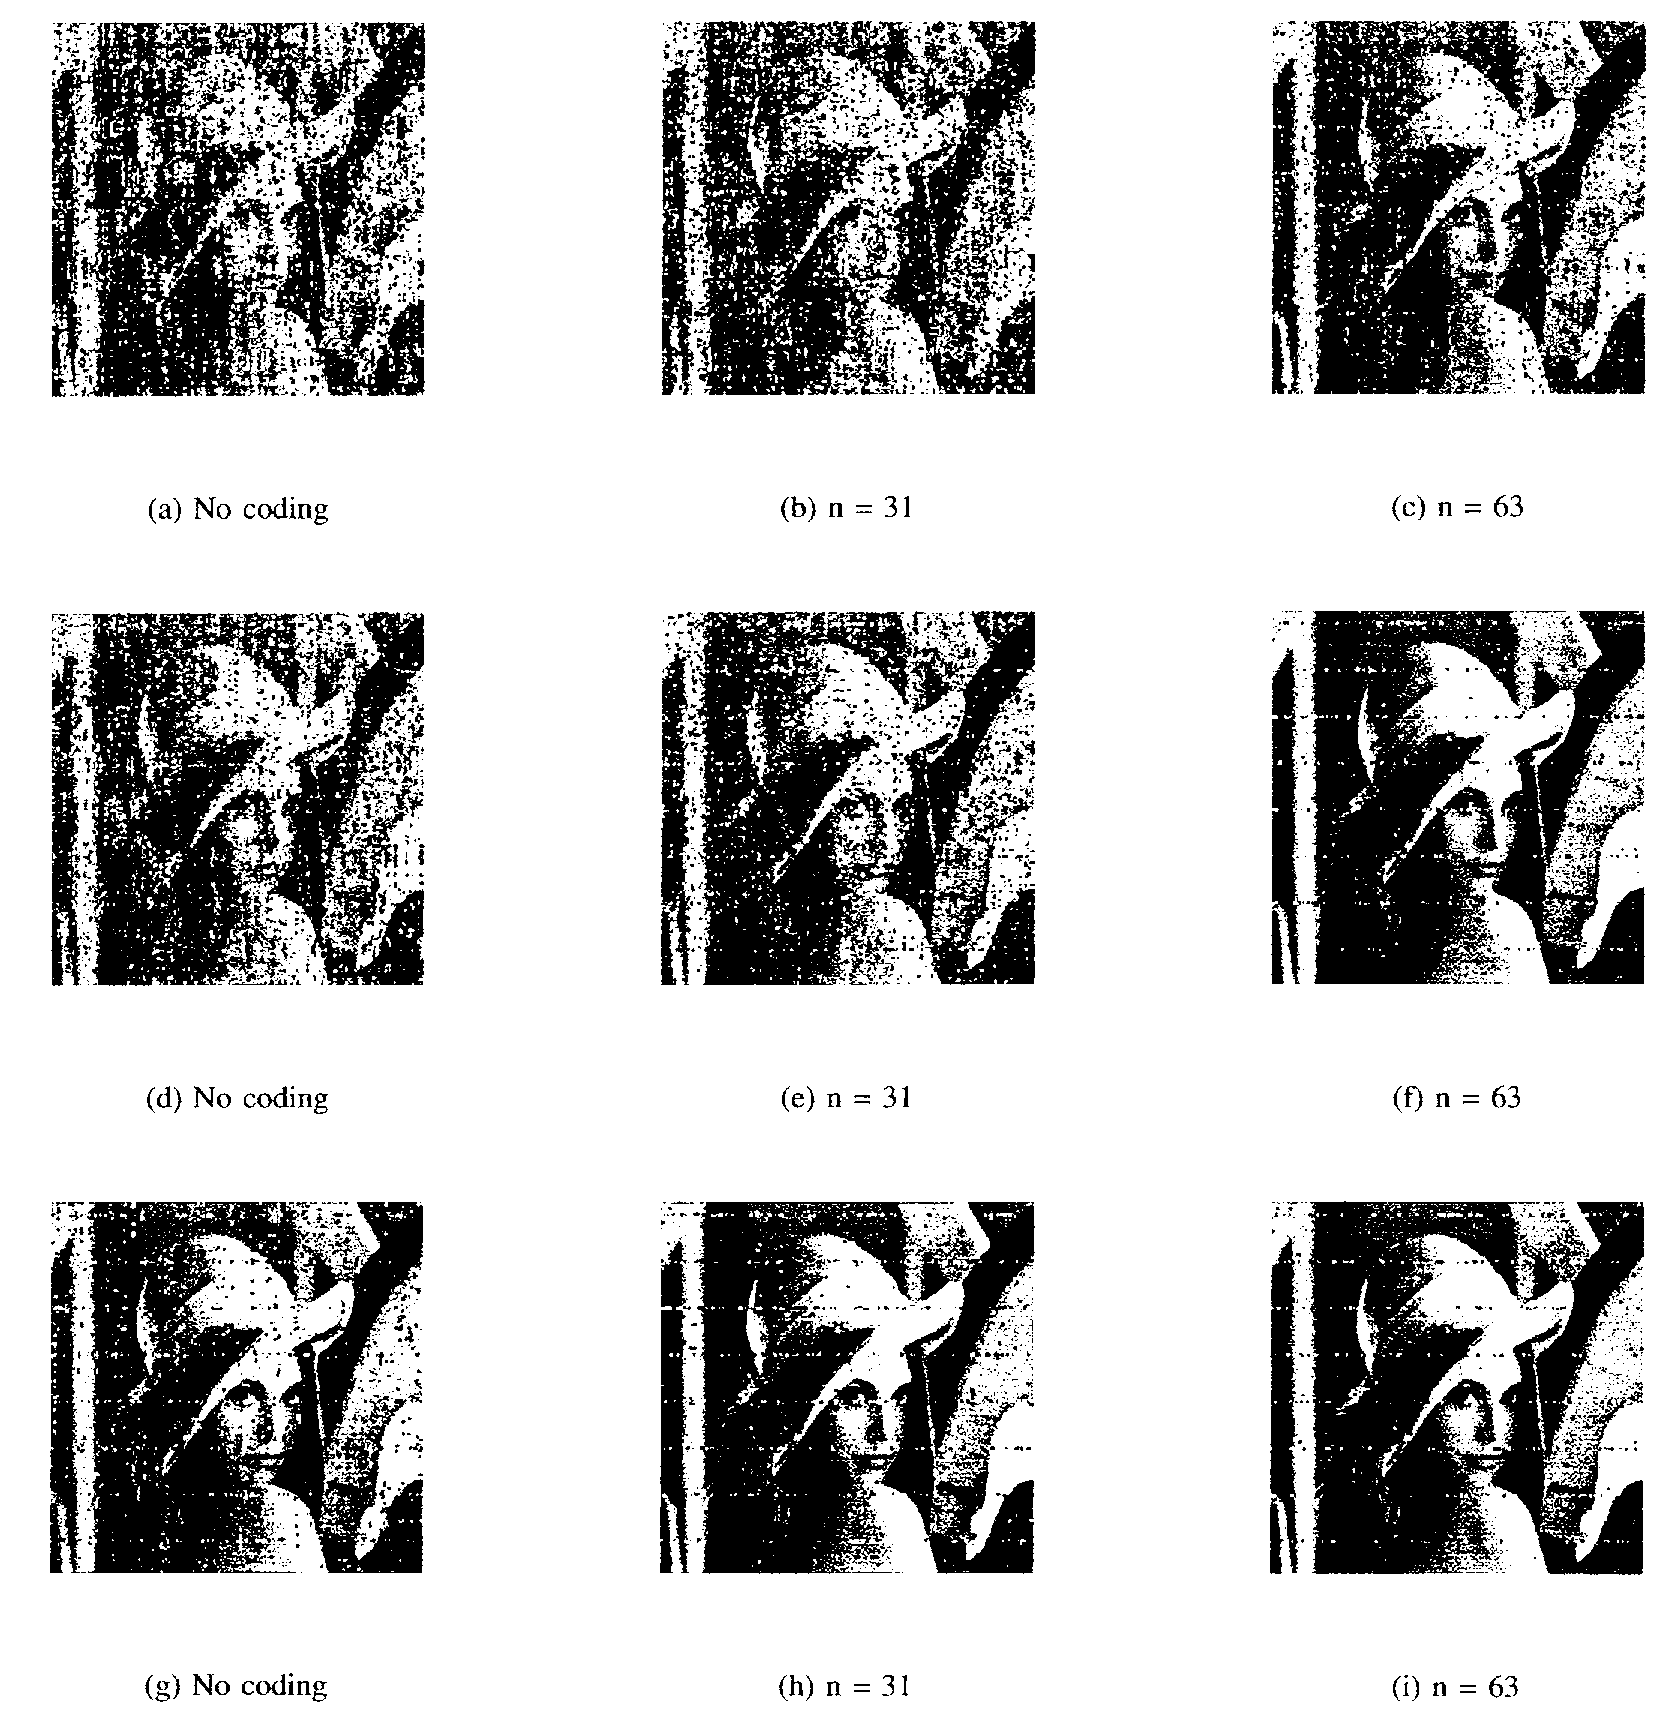
Fig.(2) shows a significant improvement in the quality of the image after using BCH coding in the three different scenarios. Also, when the size of the encoder was increased from [63; 16] to [63; 16], the quality of the image was even better. However, the efficiency of the system is degraded due to waste of bandwidth. Table III illustrates numerical results for the quality of the image in the three environments. As it can be observed from Table III and Fig.(2) that in the heavily disturbed environment there was no improvement in the quality of image with no coding and with BCH[65; 16].
However, when the encoder size increased to BCH [63; 16], the quality of image improved. This is evident in all the three
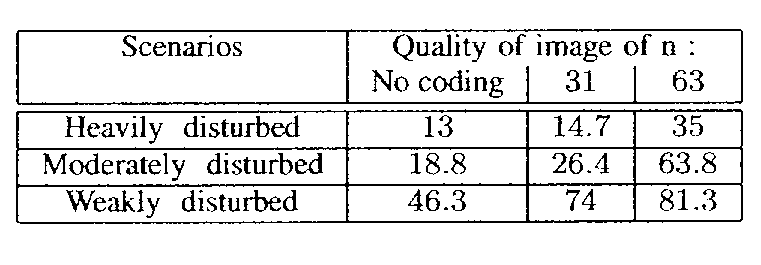
Summary
In this paper, the performance of the PLC system is studied using BCH coding. The experiments conducted showed an improvement in the quality of the image when using BCH coding under the three impulsive scenarios. However, when using encoder size of [63; 16], the quality of the image is higher with a degradation in the efficiency of the system. Therefore, depending on the application one may choose higher quality with a sacrifice in the bandwidth.

The science of today is the technology of tomorrow. Edward Teller.
Conclusions and future directions
Compressed image transmission through power line communications using the orthogonal frequency division multiplexing has been considered in this study. PLC is a very promising technique, which has been studied and developed for several decades already. However, beside the multitude of advantages of the system, there are a lot of points which need to be improved. Thus, this thesis is devoted to the issue of increasing the efficiency of both the compression techniques and PLC system.
In the first part, we have discussed the theoretical basis for the thesis issues. Compression algorithms have been introduced; their advantages and disadvantages analyzed. In addition, the schemes of PLC and OFDM were explained in detail and illustrated. We also analyzed the possible unwanted phenomena which can occur while working with signal processing; in this respect, we introduced the different kinds of noise in communication system and their impact on systems’ performance.
In the second part of this dissertation, we dealt with the experimental evaluation of the proposed algorithms. Different compression techniques such as wavelet thresholding, DWT, BTC, and DCT were implemented and compared. In addition, PLC channel work was observed in different conditions, such as noisy environment, different link length and multipath effects. In this part of dissertation, we also introduced the BCH coding scheme for error correction and illustrated its performance in PLC channel.
Summary of results
The two basic kinds of image compression, lossy and lossless was studied in this thesis. Such techniques are DWT, DCT and BTC were presented and compared in chapters 6 and 8. We also found out that the different methods can be combined in order to achieve the best results.
The experiments conducted in chapter 6 showed that the DCT transform commonly used in JPEG compression performed poorly when used in FFT-OFDM wireless communication systems. The DWT performed well over all SNRs with very similar errors over all wavelets and wavelet orders for high SNRs of 25 – 30 dB.
We also discovered that the wavelet order did affect the compression ratios with an obvious linear decrease in compression ratio when wavelet filter order is increased, this was apparent over all families of wavelets.
In chapter 6 we have also presented a comparison of different kinds of wavelets for image compression. The Daubechies family and the Biorthogonal family performed the best. At the same time, in terms of error rate the low filter orders in these two families gave less error in comparison with the Daubechies first order and Biorthogonal 1.1 order wavelet transforms’ results.
The experimental comparison between DWT and BTC for compressed image transmission showed that BTC has a better performance than DWT with lower compression factor and lower RMS over all SNRs. In terms of computational complexity, the BTC method is more complex than DWT method. This is due to the fact that in BTC we process the image in spatial domain and extract the coefficients locally while in DWT the coefficients are extracted globally. Furthermore, the compression factor for BTC with size of block 2 x 2 is less than DWT, however, both quality and RMS is better than DWT.
In chapter 7 we presented the optimum wavelet thresholding technique for image compression. The experimental results showed that the intersection between the zero-clusters and the Structural Similarity index curves outperforms the other thresholding algorithms in the sense of the trade-off between the compression ratio and image quality.
We also investigated the effects of multipath and impulsive noise on a compressed image using two different compression techniques. A comparison between BTC compression method and DWT compression method showed that both compression methods were affected by impulsive noise and number of paths (i.e. degradation in the quality of image). However, the effect of impulsive noise on DWT was higher than BTC, resulting in a lower quality of the reconstructed image. In terms of compression factor alone, BTC performed better than DWT, giving high compression factors while maintaining the quality of image.
Studying the PLC performance, we paid attention to the factors which influence the system work significantly. Thus, in chapter 9 we analyzed the effects of number of paths and length of link on the quality of image transmitted over noisy PLC channel using OFDM. The simulations showed that the image quality is highly affected by the interaction of the distance of PLC channel link and the number of multipath reflections.
We also studied such phenomena as noises in communication system. The special attention was paid to impulsive and AWGN noises. In chapter 9 we observed PLC performance under different kinds of impulsive noise. We compared the influence of the asynchronous impulsive noise and the periodic impulsive noise synchronous to the mains frequency on PLC channels performance. The experiments conducted showed that both types of noise performed similarly in the three impulsive noise scenarios. At specific values for average time of each impulsive noise and SNR, the BER performance increased with the increase in the IAT.
It was concluded that noises of different kinds and other factors like interference greatly affect communication system performance; therefore, studying the methods of their liquidation was also included in the study. We presented the BCH coding as a technique for error correction in a communication channel in chapter 10. The experiments showed an improvement in the quality of the image when using BCH coding under the three impulsive scenarios. However, when using encoder size of [63; 16], the quality of the image is higher with a degradation in the efficiency of the system. Therefore, we discovered that depending on the application one may choose higher quality with a sacrifice in the bandwidth.
Future directions
Working with the digital and power line communications, we had to study a lot of different technologies. For instance, we learned about the work of various types of signal modulation; we also had a chance to compare some of the techniques for image compression; in addition, we studied the influence of all the possible factors on the process of transmission and coding.
However, having studied the different aspects of the mentioned systems and their peculiarities, we have faced some of their disadvantages. Some of them need a deeper investigation which can help to improve the modern technologies. The field of electrical engineering is a constantly developing branch; that is why there is still a lot of space left for different studies to be conducted. Therefore, we’d like to list several areas in this dissertation that can be extended through further research. We are doing this in order to help the future researchers and inspire them to develop the study. We hope that our experience will be helpful in theoretical or practical respect for those who will be studying and working in the sphere of signal processing and electrical engineering.
Thus, the possible points for the further research we would like to outline are:
- The orthogonal frequency division multiplexing which was used in all the experiments of this thesis as a basic modulation scheme proved to have a very large peak-to-average power. This makes working with the system rather complicated. When combined with the Doppler shift, the large peak-to-average power degrades the system’s performance significantly. Thus, it is worth investigating the methods of decreasing the peak-to-average power in OFDM.
- Although the level of noise in PLC system can be decreased by different techniques, they cannot be neutralized completely: it still suffers from noises of the different electrical devices. In real life such noises are much more harmful than the results of experiments show. That is why the new solutions for this problem need to be introduced. The conducted experiments showed that all the kinds of impulsive noise performed similarly in PLC system with different noise scenarios. This fact makes the task easier, as it suggests that there has to be one universal solution which can eliminate all the kinds of noises in communication system.
- In the thesis, we have also presented different compression algorithms, such as BTC, DWT, and DCT. We compared their effects in the system and presented the illustration of their work in real-life conditions. However, there is still a multitude of experiments which can be conducted on compression techniques. For instance, there is an opportunity to combine the different techniques in order to derive the algorithm which would have the advantages of several compression methods.
- Comparing BTC and DWT algorithms, we figured out, that the DWT is more vulnerable to the impulsive noise effects. It also performed poorly in other aspects comparing to BTC. However, the implementation of BTC can be rather inconvenient, as it is a much more complex algorithm. Therefore, BTC technique has to be simplified in order to make this technique more suitable for wider implementation.
- When studying the BCH code, we noticed that in order to achieve a good quality of data the user has to sacrifice the bandwidth. And the reverse effect is, in case of bandwidth preservation, the quality can be degraded significantly. Thus, the deeper studying of the issue has to be done. For example, BCH code can be added to some other error correction technique in order to achieve better results.
- One of the most doubtful questions at the moment is the standardization of PLC and its different applications such as BPL. In USA, there were some attempts to partly standardize the technique; however, this process was not really successful. While the electric cables are installed everywhere, the users cannot even imagine what opportunities they can give to the customers. That is why developing this technology and finding the new ways of its implementation can fasten the process of its standardization.
- We would also advise to compare the influence of the different compression algorithms on different types of images in future. For instance, the medical images, photographies, paintings and other kinds of images can be compared. In addition, the experiments can be also conducted with colorful images. The content of the image is also important, for example when applying the thresholding; thus, it is worth comparing images which have different view.
- One of the possible researches in the particular field is the investigation of the roles of each mage compression method on the market. It can include the utilization of the algorithms by companies, their popularity on the international level, etc. Such study can be helpful when it is important to define a compression algorithm which would be the most profitable, or the one which is worth investigating in its further development.
- As one of the possible ways to develop this study we propose studying the digital technologies in different parts of world and the relevance of PLC and OFDM application in different countries. For instance, if the electric cables are present in every country, the PLC and BPL service is far not beneficial in some of them because of weak digital market and technological industry. Thus, in order to study the possible ways of promoting and realzing PLC as a product an investigation of its status in other countries is needed.
Besides the mentioned points, there might be some other imperfections and dark areas in the studied field. Thus, we encourage all the researchers to continue working on the topic and develop the current study, in order to improve the world of modern technology.
Works Cited
- Sheikh, H and Bovik, A. “Image Information and Visual Quality.” IEEE Transactions on Image Processing 2006.
- Sheikh, H and Bovik, A. “No-Reference Quality Assessment Using Natural Scene Statistics: JPEG2000.” IEEE Transactions on Image Processing.
- Sheikh, H, Sabir, M, and Bovik, A. “A Statistical Evaluation of Recent Full Reference Image Quality Assesment Algorithms.” IEEE Transactions on Image Processing.
- Wang, Z, Bovik, A and Sheikh, H. “Image Quality Assessment: From Error Visibility to Structural Similarity.” IEEE transactions on Image Processing 2004.
- Ma, Y, So, P, and Gunawan, E. “Performance Analysis of OFDM Systems for Broadband Power Line Communications Under Impulsive Noise and Multipath Effects.” IEEE Transactions on Power Delivery 2005.
- Al-Hinai, N, Neville, K, Sadik, A, and Hussain, Z. “Compressed Image Transmission over FFT-OFDM: A comparative Study.” ATNAC 2007 Christchurch, New Zeland.
- Bingham, J. “Multicarrier Modulation for Data Transmission: An Idea Whos Time Has Come.” IEEE Communications Magazine 1990.
- Schwartz, M. Information Transmission, Modulation, and Noise 4th edition. Singapore: McGraw Hill, 1990.
- Du Bois, D. “Broadband over Power Lines (BPL) in a Nutshell” Energy Priorities 2004
- Ma, Y, So, P, and Gunawan, Y. “Analysis of Impulsive Noise and Multipath Effects of Broadband Power Line Communications.” POWERCON 2004. Singapore.
- Pimentel, P. Baldissin, A, Cesar, L, Framil, R, and Pascalicch, A. “Revolution in the Distribution (Use of the Technology Power Line Communication in the Transmission of Data, Voice and Images).” 2004 IEEE/PES.
- Zimmermann, M, Dosert, K. “A Multipath Model for the Powerline Channel.” IEEE Trans. Communication 2002.
- Ackerman, K., Dodds, D., McCrosky, C. “Protocol to avoid noise in power line networks.” International Symposium on Power Line Communications and Its Applications 2005.
- Conte, E., Di Bisceglie, M., Lops, M. “Optimum detection of fading signals in impulsive noise.“ IEEE Transaction On Communications 1995.
- Oh, H-M, Park Y-J, Choi S, Lee J-J, and Whang, K-C. “Mitigation of Performance Degradation by Impulsive Noise in LDPC Coded OFDM System.” 2006 IEEE International Symposium.
- Simois, F, Acha, J. “Study and Modeling of Noise on the Low Voltage Part of the Electrical Power Distribution Network between 30 kHz and 1 mHz.” 2001 IEEE/PES.
- Belc, D. A Hybrid Wavelet Filter for Medical Image Compression. PhD Dissertation, Florida State University, College of Engineering, 2006.
- Delp, E, Mitchell, R. “Image Compression Using Block Truncation Coding.” IEEE Trans. On Communications, 1979.
- Digital Image Compression. Web.
- Guy E. “Introduction to Data Compression” Computer Science Department, Carnegie Mellon University.
- Lee, D, Dey, S. “Adaptive and Energy Efficient Wavelet Image Compression for Mobile Multimedia Data Services.” IEEE International Conference on Communications 2002.
- Venkateswaran, N, Arunkumar, J, Deepak , T. “A BTC-DWT hybrid image compression algorithm.” VIE 2006.
- Healy, D. Mitchell, O “Digital Video Bandwidth Compression Using Block Truncation Coding.” IEEE Transactions on Communications 1981.
- Mitchell, R, Delp, E. “Multilevel Graphics Representation Using Block Truncation Coding.” Proceeding of the IEEE 1980.
- Khedr, M, Sharkas, M, Almaghrabi, A, and Abdelaleem, O “A SPIHT/OFDM with Diversity Technique for Efficient Image Transmission over Fading Channels.” WiCom 2007.
- Cimini, J. “Analysis and Simulation of a Digital Mobile Channel Using Orthogonal Frequency Division Multiplexing.” IEEE Transaction On Communications 1985.
- Li, Y., Cimini, L., Sollenberger, N. “Robust channel estimation for OFDM systems with rapid dispersive fading channels.” IEEE Transactions on Communications 1998.
- Rationale for a Large Text Compression Benchmark (2006). Web.
- Abbate, A, DeCusatis, C, and Das, P. “Wavelets and Subbands: Fundamentals and Applications.” Applied And Numerical Harmonic Analysis 2002.
- Antonino, M, Barlaud, M, Mathieu, P, and Daubechies, I. “Image Coding Using a Wavelet Transform.” IEEE Transactions on the Image Processing 1992.
- De Queiroz, R, Choi, C, Huh, Y, and Rao. “Wavelet Transforms in a JPEG-like image coder.” IEEE Transactions on Circuits and Systems for Video Technology 1997.
- Mallat, A. Wavelet Tour of Signal Processing. San Diego: Academic Press, 1999.
- Sungwook, Y., Earl, E. “DCT Implementation with Distributed Arithmetic” IEEE Transactions on Computers 2001.
- I-Ming P., Ming-Ting S. “Modeling DCT coefficients for fast video encoding.” IEEE Transactions on Circuits and Systems for Video Technology 1999.
- Zimmermann, M, Dostert, K. “Analysis and modeling of impulsive noise in broad-band powerline communications.” IEEE Trans. Electromagn. Compat. 2002.
- Coleri, S, Ergen, M, Puri, A, Bahai, A. “Channel estimation techniques based on pilot arrangement in OFDM systems.” IEEE Transactions on Broadcasting 2002.
- Raghupathy, A. Liu, K. “Algorithm-based low-power/high-speed Reed-Solomon decoder design” IEEE Transactions on Circuits and Systems II: Analog and Digital Signal Processing 2000.
- Chang, R. “Synthesis of band-limited orthogonal signals for multi-channel data transmission.” Bell Systems Technical Journal 1966.
- Robertson, P. Kaiser, S. “The effects of Doppler spreads in OFDM(A) mobile radio systems.” Vehicular Technology Conference 1999.
- Zimmermann, M and K. Dostert, “A multi-path signal propagation model for the powerline channel in the high frequency range,”in Proc. 1999 ISPLC Conf, pp. 4551.
- Cheh, Y, Parhi, K. “Area Efficient Parallel Decoder Architecture for Long BCH Codes.” Proc. IEEE Int. Conf. Acoustics, Speech, and Signal Processing 2004.
- Zhang, X, Parhi, K. “High-Speed Architectures for Parallel Long BHC Encoders.” IEEE Trans. On Very Large Scale Integration (VLSI) Systems 2005.
- Wang, Z, Bovik, A, and Lu, L. “Why is Image Quality Assessment So Difficult.” IEEE Int. Conf. Acoustics, Speech, and Signal Processing 2002.
- Haykin, S. Digital Communications. Toronto: John Wiley & Sons, 1988.
- Couch, L. Digital and Analog Communication Systems, 6th Edition. New Jersey: Prentice-Hall, 2001.
- Proakis, J. Digital Communications. Singapore: McGraw Hill, 1995.
- Gibson, J. Principles of Digital and Analog Communications. New York: MacMillan, 1990.
- Nister, D, Christopoulos, C, “Lossless region of interest with embedded wavelet image coding” Signal Processing, 1999.
- Ortega, A, Ramchandran, K, “Rate-distortion methods for image and video compression.” IEEE Signal Processing Magazine, 1998.
- Liu, J., Li, H., Chan, F., Lam, F. “Fast Discrete Cosine Transform via Computation of Moments.” Journal of VLSI Signal Processing Systems 1998.
- Ahmed, N., Natarajan, T., Rao, K. “Discrete Cosine Transform.” IEEE Transaction on Computers 1974.
- Lap-Pui Ch., Yuk-Hee Ch., Wan-Chi S. “Concurrent Computation of Two-dimensional Discrete Cosine Transform.” Circuits, Systems and Signal Processing 1996.
- Stern, H, and Mahmoud, S. Communications Systems. New Jersey: Prentice Hall, 2004.
- Contemporary Mathematics. 2007. Web.
- Andreadou, N, Assimakopoulos, C, and Pavlidou, F. “Performance Evaluation of LDPC Codes on PLC Channel Compared to Other Codec Schemes” ISPLC’ 2007.
- Sklar, B. Digital Communications Fundamentals and Applications New Jersey: Prentice Hall, 2001.
- Chang, R. and Gibbey, R. “Orthogonal multiplexed data transmission.” IEEE Transactions on Communications Technology 1968.
- Chuang J, Sollenberger N. “Beyond 3G: Wideband Wireless Data Access Based on OFDM and Dynamic Packet Assignment” IEEE Communication Magazine 2006.
- Goering, R, “Matlab edges closer to electronic design automation world.” EE Times 2004.
- Gonzalez, R, Woods, R, Thresholding in digital image processing, Pearson Education, 2002.
- McClaning, K., Vito, T. Radio Receiver Design Noble Publishing Corporation.
- Peebles, P. Digital Communication Systems New Jersey: Prentice Hall, 1987.
- Saltzberg, B. “Performance of an efficient parallel data transmission system.” IEEE Transactions on Communications Technology 1967.
- Shapiro, L, Stockman, G, Computer vision Prentice Hall, 2002.
- Y LI, L, Cimini, J, Sollenberger, N. “Robust Channel Estimation for OFDM Systems with Rapid Dispersive Fading Channels.” IEEE Trans. On Communications 1998.