Introduction
Today, China is ranked as the second largest economy after the United States. Numerous countries have benefited from China’s high demand for imported products and raw materials. One of the countries that have significantly benefited from exporting its products to china is Canada. High demand for imported goods in China has seen Canada increase its exports to the country. Besides, there has been a growing pressure on product prices as a result of increased industrialization in China. This has earned Canada a potential market in China. Initially, Canada exported wheat only to China. However, increase in demand for varied products in China has led to the Canada diversifying its exports. Today, China imports forestry products and industrial goods from Canada.
China’s share of Canada’s total exports
In early 2007, the Canada’s export to china surged by 43%. This led to China being the third-largest consumer of Canadian products. During this year, Canadian exports to China were reported to double totaling to eight billion Canadian dollars. Despite Canada still importing more from China than it exports, its share of export to the country has been reported to significantly increase compared to the share of imports. The major reason for this increase has been China’s process of expanding and increasing the number of its industries. Some of the Canada’s products that have been reported to be highly demanded in China include industrial goods, canola, metals and potash (Foreign Affairs and International Trade Canada para. 3-7). Currently, Canada exports 24% of its total products to Asian countries; China being the main importer. Today, China is the second biggest importer of Canadian crude oil. In 2007, Canada earned 150 million dollars from exporting crude oil to China. This was during the first seven months.
Recent trends in Canada’s export to China
In the early 1990s wheat used to be major in Canada’s export to China. By 1992 wheat accounted for 60% of the total exports that originated from Canada. However, with time the amount of wheat shipped to China from Canada has gradually decreased and today it accounts for only 10% of total Canada’s exports to China. The decline in wheat exportation marked the beginning of the exportation of other food products such as seafood and oilseeds. Initially, China used to import an insignificant amount of these products from Canada (Grunau para. 2-7). Between 1990 and 2003, the volume of seafood exported to China from Canada rose from $3.2 million to $250 million. This was attributed to a change in feeding modes by the Chinese. With time the Chinese per capita use of cereal products has gone down by 40% while the rate of meat consumption has risen by 30%.
China mainly imports its pork from Canada. According to Chinese import data of 2008, Canada exported pork worth 115 million United States dollars. This accounted for 10.5% of the market share placing Canada in the fourth position among the pork exporters to China. Moreover, China was in the eighth position among the pork importers from Canada. It consumed 1.7% of the total pork exported by Canada.
Over the last five years, trade between China and Canada on canola seed has been found to flourish. Canada has been exporting around 550,000 tonnes of its total canola seeds to China annually. China also produces its local canola seed. When its production is on the rise, Canada’s export to the country is found to go down. In addition, there are substitute products that greatly affect the demand for canola seeds in China due to their cheaper prices.
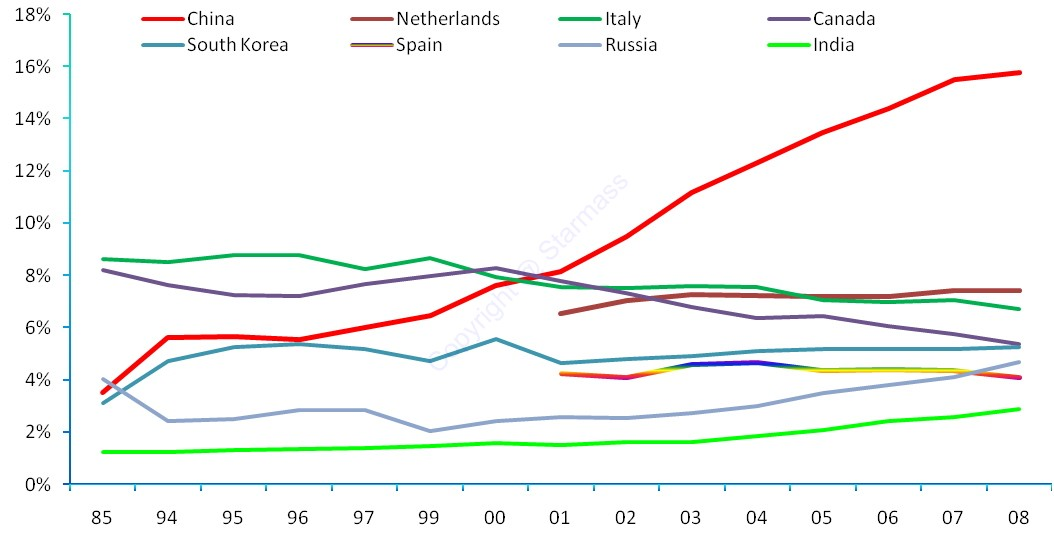
The advent of industrialization in China triggered the demand for industrial materials. This opened a new market opportunity for Canada. Demand for metals in China increased as the country continued opening more industries. By the year 2004, Canada was exporting 15.8% of its metals to China. Iron and steel, and nickel were the most needed metals in China. Their shares were 6.3% and 4.1% respectively. Other metals such as aluminum and copper were least required. Nevertheless, demand for these metals is gradually rising with time (Roy 4).
After China stopped importing wheat from Canada it was first seen as a big drawback to the country since it was its major export. However, China started growing its own wheat and it demanded chemical products to facilitate in eradicating pests that infested it. In addition, the country demanded fertilizer for growing its grains. This opened a new export opportunity for the Canadian chemical and fertilizer industries. Wheat was substituted with chemicals and fertilizer (Roy 4). 11.7% and 6.8% of chemical products and fertilizers manufactured in Canada are exported to China.
Demand for forestry products in China has also seen Canada increase its export share from 9% in 1992 to 33% by the year 2004. Currently, China is leading in the importation of pulp. On the other hand, Canada is the main supplier of the product in the world. Nevertheless, it is not the largest supplier to China and is second after the United States. In 2003, pulp exportation to China accounted for a third of Canada’s total exports to the country.
Over the last decade, there has been an increase in the volume of merchandise exported to China from Canada. In 2006, Canada exported merchandise worth $42.1 billion to China. This accounted for 5% of Canada’s total merchandise trade globally. Nine years back, China was ranked as the fourth largest importer of Canadian merchandise (Holden para. 4-6). However, the trend has drastically changed and today it is ranked second. This growth in merchandise trade between the two countries indicates that China has evolved to become a force to reckon in the world’s economy.
Future prospects of Canada’s export to China
The numerous trade agreements that have been made between China and Canada give Canada room for increasing exportation of its products to China. One of the most recent agreements is the one that gave Canada an opportunity to export its pulse to China. After joint research between the two countries proved that there were no health threats in pulse produced in Canada, China agreed to increase its import volume. Moreover, the body responsible for handling cereals and oil in China signed a memorandum of agreement with pulse Canada that was to see the nutritional value of Chinese meals boosted through the introduction of pulse constituents (Government of Canada). In this respect, the Canadian government intends to invest more than $1 million to facilitate the establishment of mills that will be responsible for producing pulse flour and other pulse constituents to be exported to China.
After mad cow disease was discovered in Canada in 2003, China banned the importation of Canadian beef. However, in 2004, the Chinese government relaxed its terms and allowed for the importation of boneless meat from Canada. This however did not significantly revive Canadian beef exportation to China. Today, the Chinese government has absolutely lifted the ban giving Canada a green light to export its beef (Government of Canada). Accordingly, the Canadian government expects its beef exportation to China to increase by 76% in the near future. It expects its yearly exportation to rise by 26 million Canadian dollars annually. China is currently witnessing a great transformation in feeding habits. People are now embracing western feeding habits. This coupled with growth in Chinese gross domestic production imply that household expenses are expected to rise in the near future. Consequently, demand for products such as beef, pork and canola will increase giving Canada a potential market for its exports.
China is in the process of opening new industries and expanding its existing ones. Consequently, there will be high demand for energy in the near future. Export opportunities in the Chinese energy sector have not yet been exploited. With Canada now strengthening its economic ties with China and establishing its companies in the country, it has an upper hand in investing in the Chinese energy sector.
One of the fields that Canada’s exports have not been found to fair well is in travel services. In 2007, its total services exports to China were at $1.1 billion. This value is expected to increase with time. The fact that Canada was granted a destination status by the Chinese government in 2009 gives it an opportunity to increase the volume of its travel services.
Canada is not popular in wine production. Nonetheless, the country exports a substantial amount of its wine to China. In 2006, the total export reached $600,000. This was an excellent performance compared to what it had exported in 2003. Icewine accounted for 71.9% of its total wine export while a variety of grape wine products accounted for 25.2%. According to Datamonitor, the rate of grape wine consumption in China is expected to rise by approximately 7% by 2011 (Berry para. 5-9). The current strong economic ties between Canada and Chine give Canada an opportunity to increase its volume of grape wine exportation to China. Besides, other categories of wine such as sparkling wine are expected to see an annual increment of 4.6% in their consumption rate. Datamonitor speculates that by 2011 household expenditures in China will have increased by 3.5%. This is with respect to what is spent on wine. Consequently, the Canadian wine industry ought not to discount these predictions as they may turn out to be of great benefit.
Conclusion
Trade between Canada and China has been found to change significantly. Canada has taken the opportunity of the Chinese industrialization trend to diversify its exports in the country. The country has stopped depending on wheat as its major export to China and is currently exporting pulp, industrial goods and metals to China. Besides, the current increase in China’s gross domestic production and change in feeding habits pose a potential for an increase in Canada’s exports to the country. The Chinese government has lifted some of the trade restrictions that prevented Canada from exporting its beef and pork to China. Consequently, there are high hopes that the country’s share of beef and pork exports is going to increase in the near future. As more people in China start using wine, the volume of wine imported from Canada is expected to rise significantly by 2011.
Works Cited
Berry, Ben. “The wine market in China: Opportunities for Canadian wine exporters.” Agriculture and Agri-Food Canada. Web.
Foreign Affairs and International Trade Canada. “Canada’s international market Access report – 2008.” Web.
Government of Canada. “Canada makes a historic progression on Agriculture partnerships in China.” Canada-China Agriculture and Food Development Exchange Centre. Web.
Grunau, Steve. “Feeding the Dragon: Canadian exporters and a booming China.” Statistics Canada. Web.
Holden, Michael. “Canadian trade and investment activity: Canada-China.” International Affairs, Trade and Finance Division. Web.
Roy, Francine. “Canada’s trade with China.” Micro-Economic Analysis Division Statistics Canada. Web.
Appendix
Figure 1. Canada trade with China. Web.
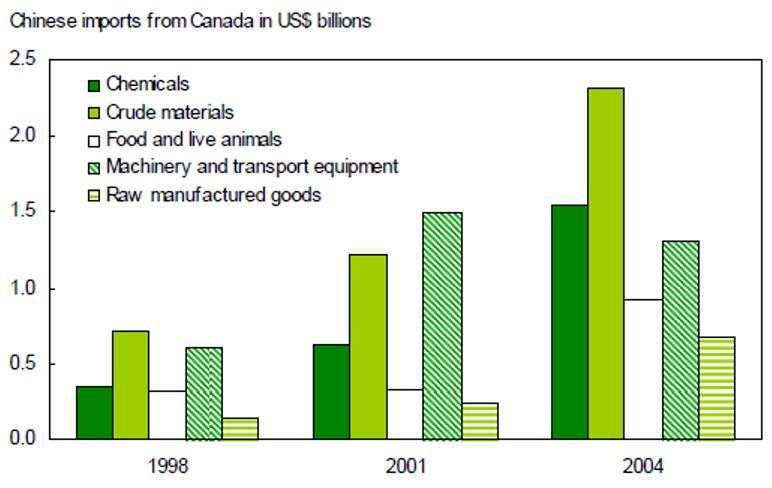
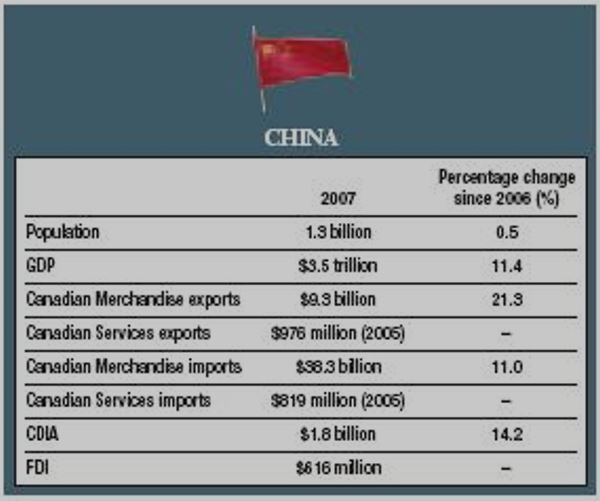
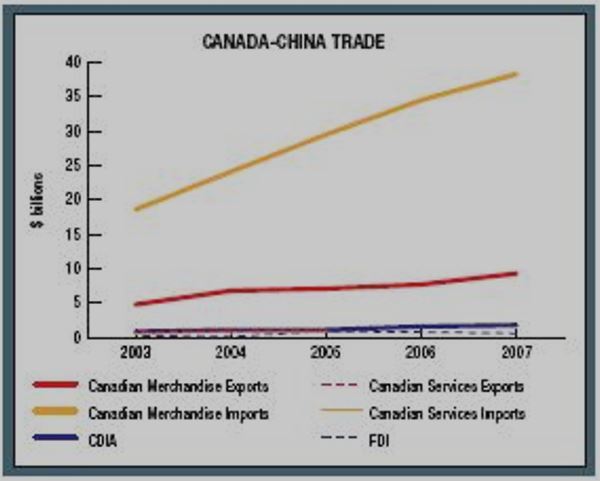
Figure 4. China’s Imports From Canada 2004-2007. Web.