Abstract
The project compares the concentration of ascorbic acid, commonly referred to as vitamin C in processed and unprocessed fruit samples. Fruits such as strawberries and pineapples are the major sources of vitamin C to the body. They are highly perishable and industries have found it necessary to process them so as to increase their life-shelf. Freezing procedures are known to have partial effect on the original levels of ascorbic acid in fruits with the demise happening during freezing and storage processes like canning, and manufactures have employed parameters such as total ascorbic acid and reduced ascorbic acid levels to device appropriate processing procedures that yields minimum degradation of ascorbic acid. The project evaluates levels of ascorbic acid retained through freezing and canning processing methods. Fresh fruits are treated as the controls and the amount of ascorbic acids present determined using colorimetric methods. This is by generating a calibration standard curve using solutions which concentrations are known and using the linear curve to determine the concentrations of the unknowns. The wavelength that yields highest absorbance for ascorbic acid was evaluated and found to be 700nm which was used throughout the experiment.
The total ascorbic acid was found to be largest in the 10 µg/ml frozen strawberry extracts having a 96.32%. This was also similar when comparing 20µg/ml extracts and thus, in general, frozen strawberry extracts were found to be having the largest total ascorbic acid levels. Across the 10 20 and 50 µg/ml extracts, the total ascorbic acids in fresh strawberry extracts was found to be lowest and moderate in canned strawberry extracts. The maximum concentration of ascorbic acid determined in fresh pineapple samples was 28.800± 0.363µg/ml while the least was 7.217 ± 0.094. For the canned samples, the maximum and minimum values obtained were 34.183 and 7.983 µg/ml respectively whereas for frozen samples, the values ranged between 30.950 and 5.050. Student’s t-test was used in hypothesis testing and it was found that in both frozen and canned pineapple and strawberry samples, there were significant differences in the level of ascorbic acid when compared with that of fresh samples.
Introduction
Ascorbic acid commonly referred to as vitamin C is used extensively in the food industry, not only because of its nutritional value but for its diverse functional contributions to food quality such as taste, colour and palatability. For instance, fruits such as mangoes, pineapples, berries and papaya have diversified tastes and flavours owing to its presence and make up excellent sources of various minerals and vitamins in the diet (Rababah, Ereifej and Howard 2005). It is also added to soft drinks to restore any loss that may have occurred during processing and to prevent flavour deterioration with time.
There are various natural sources of vitamin C which include oranges, green peppers, watermelon and raw and partly cooked leafy vegetables such kales and spinach. Most fruits also provide a good source of vitamin C. These fruits include strawberries, raspberries and pineapple and are a rich source of vitamin C. Leafy green vegetables are the most available and cheapest source of substantial amounts of vitamin C (Cadenas and Packer 2001). However, ascorbic acid, just like most other vitamins, is sensitive to light, air, and heat and hence for their effective consumption, fruits are best eaten when fresh and ripe and vegetables when raw as salads or lightly cooked. Cooking alters by chemical properties of vitamins and other necessary elements in food by transforming them into states which are difficult to assimilate hence destroy the antioxidant food components (Porter, 2012).
The role played by Vitamin C cannot be underestimated. Deficiency in vitamin C leads to a condition referred to as ‘scurvy’; though it is a rare health condition. According to American Cancer Society (2013), deficiency in vitamin C levels within the body, can be suppressed by large intake of either natural or synthetic vitamin C, which are available a variety of forms such as chewable tablets, capsules, powders and may also be available in liquid form. This condition is characterized by signs and symptoms such as bleeding gums, slowed healing of wounds, rough and dry skin, dry and easily-breaking hair and a decreased immunity against diseases.
Huge dietary intake of Vitamin C is known to prevent medical complications such as common cold, production of healthy gums, prevent dry and scaly skin, reduce allergy-related medical complications such as asthma and to boost the natural immune system (Hathcork, 2004).
Other Functions of Vitamin C
Among the numerous antioxidants found in fruits, vitamin C has the most significant biological role in the human body. Vitamin C donates electrons to free radicals produced from oxidation and prevent them from taking electrons (reducing) from useful molecules in the body (Hickey & Saul 2009); thereby, preventing disruption of such functional molecules.
Vitamin C is necessary for human growth and repair of tissues, tendons, ligaments and blood vessels through the formation of collagen. Vitamin C is slightly acidic and is partially soluble in alcohol, and insoluble in chloroform, ether and benzene (Rickman, Barret & Bruhn 2007). The formula for ascorbic acid is C6H8O6 and the figure below represents its chemical structure:

Nutritional compounds present in fruits include vitamins, fats, proteins, minerals, and sugars. Indeed, fruits are the major dietary sources of vitamins A, E and C. The protective effects of a diet rich in fruit attribute to bioactive compounds having anti-mutagenic and antioxidant activity.
Effects of processing methods to the Quantity of Ascorbic Acid
The levels of ascorbic acid may vary significantly in processed and unprocessed foods. For instance, and as stated earlier, ascorbic acid is very sensitive to light and heat. Processing procedures of foods that involves exposure to heat or light may lead to the reduction of ascorbic acid levels in natural foods thereby affecting their nutritional value, taste and colour. The levels of ascorbic acid may vary significantly depending on the processing state of the various foods. For instance, According to Vasco & Ruales (2008, p. 817), the ease with which vitamin C oxidises causes it to diminish faster in fresh fruits than in processed ones, and when cooked, or processed in the open air. Ascorbic acid is freely soluble in water, and therefore, tinned fruits retain their vitamin C in the liquid.
Sinha, Barta and Cano (2012, p. 113) assert that retention of antioxidant and consequent nutritional value of fruits is the primary goal of most processing procedures, of which freezing and frozen processing is amongst the few known less destructive procedures offering long-retention of vitamin C rich fruits.
Moreover, some food processing procedures, for instance, in the manufacture of fruit juices or purees from fruits such as apples and peaches, may involve addition of ascorbic acid during the crushing, pressing or in any other processes to prevent enzymatic browning which results from oxidation of the raw fruits. Browning takes place when enzymes called polyphenolases, which are naturally present in fruits speed-up the oxidation of phenols, also naturally present in the fruit to form compounds called quinones which then react to form brown pigments called Melanins (Mahdavi, Nikniaz, Rafraf and Jouyban 2012).
Pasteurization method is also known to interfere with the amount of ascorbic acid in processed foods. For instance, even though a small number of samples ranging less than ten were used, Wernery, Johnson and Abraham (2012) report a reduction in ascorbic acid of about 6.1 % in pasteurised camel milk. The material in which a substance is stored in also leads to ascorbic acid level fluctuations with plastic containers known to decrease them by more than 10% for storages of about 3 months (Wernery, Johnson and Abraham 2012). Freezing procedures are also known to have partial effect on the original ascorbic acid content of fruits. The demise of ascorbic acid happens during the frozen storage and the freezing process. For effective comparison of amount of ascorbic acid present in processed and unprocessed fruits, the amount of total ascorbic acid and reduced ascorbic acid at various processing stages and storage times are evaluated for comparison. Manufactures have employed such parameters to evaluate best storage conditions and processing (Marques, Renfroe, Bowling, Lee and Gloeckner 2010).
The chief cause of vitamin C loss relates to the action of ascorbate oxidase, an enzyme, which breaks down ascorbic acid in presence of oxygen to dehydro-ascorbic acid. This degradation is a factor of elements such as time, temperature, fruit type and variety, nature of pre-treatments and/or freezing and packaging, among others (Sinha, Barta and Cano 2012). These factors influence retention of vitamin C in fruits differently.
This project aims at evaluating an experiment to evaluate the content of vitamin C in various processed fruits using colorimetric techniques. The method applies Folin-Ciocalteu reagent, to compare vitamin C content in fresh pineapples and strawberries against processed pineapples and strawberries. The methods of fruits processing considered are freezing and canning.
Methodology
Introduction
When white light passes through a solution, a part of the light is absorbed, reflected and part passes through the solution. The amount of light that is transmitted through the solution has been found to be related to the amount of analyte in solution and is best expressed by the Beer-Lambert’s law (Underwood and Day 1991). This law gives the relationship between the amount of light absorbed, concentration of the substance of interest and the path length. If same colorimetric cuvettes are used, the relationship is best expressed using Beer’s law which states that the intensity of light absorbed increases with concentration (Christian, 2004). If standard of known concentration are used, a linear calibration curve is obtained and can be used to evaluate the concentration of unknown solution. However, this relationship applies accurately only on low concentrations (Skoog and West 2001).
The calculation of the vitamin C content in different samples can be evaluated accurately based on the standard curve of ascorbic acid. The absorption of colour is optimal at 700 nm absorbance.
Method of Analysis
The project was aimed at comparing the content of vitamin C in fresh, frozen and canned fruits (pineapples and strawberries) using the direct colorimetric technique. Folin phenol reagent, which is an oxidizing agent, yields a blue colour on reduction, and biochemist use it for estimating amount of specific protein at pH 10 (Jagota and Dani 1982). The colorimeter uses a reagent called Folin-Ciocalteu which gives the most accurate results in the acidic pH range as the experiments were in the same pH range. Thus, Folin-Ciocalteu reagent is most appropriate reagent for this experiment as it is determined that vitamin C is slightly acidic
Samples
- 3 fresh pineapples fruits and 6 canned pineapples randomly picked from a set of 12
- 10 fresh strawberry fruits and 6 canned strawberries randomly picked from a set 12.
Reagents
- 10% trichloroacetic acid (TCA)
- 0.2 M Folin-Ciocalteu reagent,
- Ascorbic acid (stock)
- Distilled water
Method used in the preparation of standards
The sample standards to be used for the generation of the calibration curve were prepared in a series of 0, 5, 10, 15, 20, 25, 30, 35, 40, 45 and 50μg/ml solutions in 100 ml volumetric flasks. This was by initially preparing a stock solution of 50 μg/ml ascorbic acid stock solution and diluting it appropriately to make the standard solutions.
To prepare the series of 0, 5, 10, 15, 20, 25, 30, 35, 40, 45 and 50 μg/ml solutions in 100 ml volumetric flasks, 0, 10, 20, 30, 40, 50, 60, 70, 80, 90 and 100ml of the stock solution was put in I00ml volumetric flasks and topped up with water.
Method involved in sample preparation
Preparation of Strawberry samples
- The buds were removed the strawberries and 250 g of the strawberries transfer into a blender, and 250 ml of double-distilled water added.
- The mixture was then blended for 5 minutes to produce a homogeneous mixture.
- The strawberries juice was filtered into a conical flask and labelled “fresh strawberries”.
- Some of the strawberries were then preserved for 4 days in plastic boxes with perforations at room temperatures, and an equal amount of the berries frozen in refrigerators for 4 days.
- 250 g of canned strawberries were then blended with 250 ml of distilled water for 5 minutes and the filtrate of the strawberry juice collected in a conical flask and labelled ‘canned strawberries’.
- An equal number of strawberries cans were also preserved in deep freezer at room temperature and monitored to ensure constant storage condition.
Preparation of Pineapple samples
- The skin of the pineapples was carefully peeled off and the peeled pineapple cut into small pieces. The same procedure used in the preparation of strawberries samples was also applied in this preparation.
- Some pineapple fruit cans were also preserved at room temperature and an equal number in the refrigerator. The daily temperature and humidity of the laboratory were also monitored on a daily basis.
Evaluation of λmax
The first experiment carried out involved evaluation of λmax value for the assay of ascorbic acid. This involved used of a standard solution of 0.200mg Ascorbic Acid and 0.2ml of 0.2M Folin-ciocalteu in 1 ml of water. The instrument’s wavelength was then scanned between 0 and 1000 nm to evaluate λmax showing the highest wavelength.
Linear Standard Curve Check
This involved use of a wide range of ascorbic acid concentrations to determine where the assay was linear or otherwise and to what range could Beer’s law remain applicable in the analysis of ascorbic acid. For this, 0-200 μg/ml range of ascorbic acid standards was used.
The standard solutions were then run in the spectroscopic colorimeter at 700 nm and their absorbance used to generate a calibration curve and evaluate to which range linear deviation occurs.
Analytical Procedure
For the experiment, sample of strawberries and pineapple were used and to ensure that the comparison was effective 3 samples of each at the different processing states, i.e. fresh, frozen and canned were considered. This gave a total sample number of 9 without considering the blanks.
- 0.800ml of 10% trichloroacetic acid was added to 0.2ml of each fresh Strawberry and Pineapples extracts in different test tubes.
- Using a mechanical shaker, the tubes were shaken for 1 minute and the mixture then placed in ice for 5 minutes.
- The test-tubes were then put on Centrifuge at 3000 rpm for 5 minutes at and the solution checked for clarity. It was found to be clear.
- The supernatants were then cautiously transferred into another set of test tubes to avoiding swirling the pellet.
- 0.2 ml of the supernatants from each sample was used to determine vitamin C concentration. This was by:
- First diluting the extract to 1800ml using distilled water and adding 0.2ml of 0.2 M folin’s reagent which is approximately two drops to the extract and shaking it thoroughly.
- The mixture was then left to stand for 10 minutes at room temperature for the reaction to take complete.
- The absorbance of light by the samples was then measured at 700 nm after doing the instrumental background measurement.
The background measurement was done for the fresh fruit samples, frozen and the canned one. For the background determination of the fresh samples the procedures for methods used involved:
0.800ml of 10% TCA was added to 200ml of extract of each sample while for the blank, a mixture of 200ml water and 0.2ml folin was used. This was also the case for the frozen and canned samples. However, two other methods for comparison were done for both the frozen and canned samples.
The second method involved increasing the extract to 400ml for each samples (Strawberry and Pineapples) while the blank preparation was a mixture of 2000ml water and 0.2 ml folin while the third method involved 800 ml sample and a blank of 1600 ml water and 0.2 ml folin.
The samples were also run at the same wavelength and the calibration curve used to determine the concentration of the ascorbic acid in the samples.
N.B: Precautionary measures were taken by wearing protective gear and in particular gloves, to prevent the corrosive TCA and Folin-Ciocalteu from coming into contact with skin.
Results
Data obtained for λmax
From the instrumental wavelength scan, data obtained are given below:
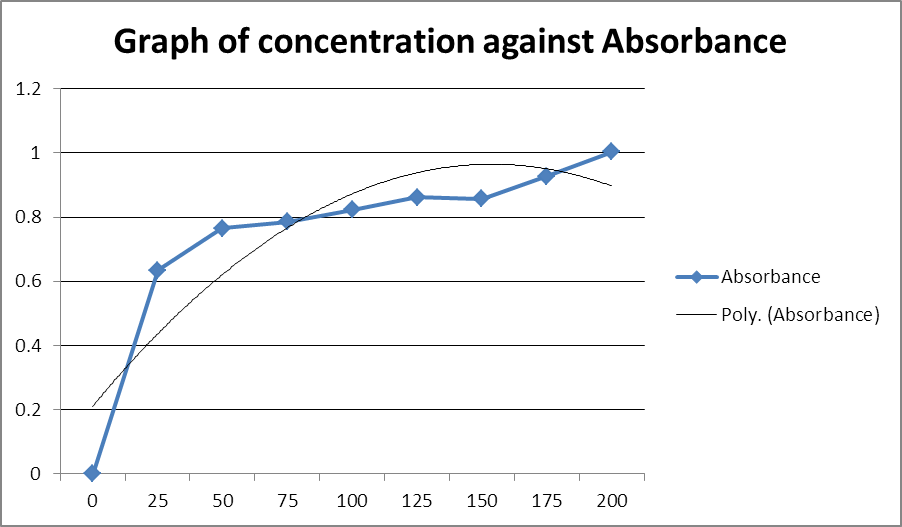
Calibration curve for linear deviation evaluation
The instrumental data obtained for the range 0-200 μg/ml were measured and the values plotted to enable the evaluation to which Beer’s law holds appropriately in the analysis of ascorbic acid.
Table 1: Absorbance values for various standard concentrations
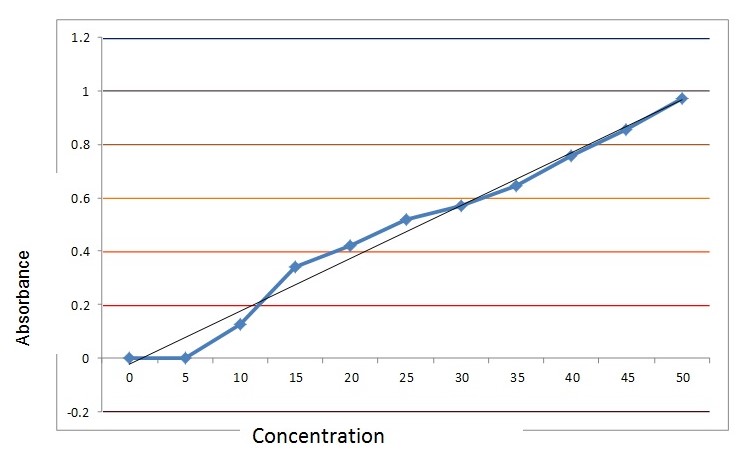
Results for the standards
The absorbance data obtained from the colorimeter using the standard solutions is given below:
Statistical techniques
Analysis of the results and data presentation was done using Microsoft Office Excel 2010. Since the experiments were done in triplicate, the data obtained were expressed as means ± standard deviation (SD) of various experiments taken from one extract of each processing method.
Various formulas for this comparison exist depending on the data available. Here, the student’s t-test was used to evaluate whether there was any significant difference between the control sample which, in this case, was the fresh pineapples and strawberry samples and compared with the processed ones. 95% level of confidence was used and, hence, an alpha value, also commonly called a risk value of 0.05, employed. The formula employed in the calculations was:
 =
=
The standard error of mean is given by:
Standard error of mean =![]()
Variance is given by the square of standard deviation.
Data analysis
The y axis is representing the absorbance while the x axis represents concentration. The equation of the line of best fit can be obtained using the regression equation y=bx +a
Where:


Thus, the relationship between the two can be expressed using the regression equation which can then be used to find the concentration of the unknowns:
Table 2: values for calculation of regression equation
From these values, the regression equation was found to be:
![]()
Data Presentation
By use of the regression equation, the calculated concentration of the strawberries’ samples in different processing states from the absorbance measured is given below:
Table 3: Comparison of total ascorbic in fresh, canned and frozen strawberry samples
Table 4: Values of absorbance and calculated concentration for strawberries
The calculated concentration of the pineapple samples in different processing states is given below:
Table 5: Values of absorbance and calculated concentration for pineapple
Student’s t-test result
The student’s t-test tests the null hypothesis that the mean of the control samples is equal to the mean of the processed samples. It takes into consideration the population means of the samples and compares whether they are similar.
Table 6: Two-Sample T-Test and Confidence Interval for fresh, canned and frozen strawberries samples
Table 7: Two-Sample T-Test and Confidence Interval for fresh, canned and frozen pineapple samples
Table 8: Quantity of ascorbic acid in the samples. The table gives a summary of the samples which were done in triplicates and their associated ± SD
Discussions
To determine the wavelength that would give maximum absorbance for ascorbic acid in solution, a scan of the wavelength was ran and the associated absorbance measured and recorded. Gradual increase of absorbance was observed with increase in the wavelength of light until a maximum was reached. It was found that the largest absorbance occurred when the wavelength of light was at 700nm giving an absorbance of 0.780. Beyond this, a gradual decrease was observed with increase in wavelength. This means that the best wavelength for measurement of the concentration of ascorbic acid would best be realized at 700 nm and was used throughout the other experiments.
To ensure reproducibility and reduce effects of human errors, the data analysis was done in triplicates and an average obtained. These average data are the one represented in the tables. The data plot in the evaluation of the extent to which analysis of ascorbic acid using colorimetric method would follow linearity did not follow a straight path exactly. These deviations could be attributed to human error, differences in instrumental response and other factors such as variations in the measuring conditions to effect of temperature changes. This necessitated for use of a trend line with the best fitting being a polynomial trend-line of order 2. This showed that the standard curve of ascorbic was generally linear up to a concentration of about 75 µg/ml of ascorbic acid beyond which significant deviations to non-linearity appeared.
The standard calibration curve was also found not to be exactly linear. However, using the exact data, the equation of a straight line was generated using regression analysis of the form y=bx+ a. Such an equation can be used for extrapolation and estimation of a wide range of solutions assuming that the law holds across the concentration range. This generated an equation of a straight line which could be used to estimate the values of the unknown solution and was used to calculate the concentration of the fresh, frozen and canned strawberry and pineapple samples.
The total ascorbic acid was found to be largest in the 10 µg/ml frozen strawberry extracts having a 96.32%. This was also similar when comparing 20µg/ml extracts and thus, in general, frozen strawberry extracts were found to be having the largest total ascorbic acid levels. Across the 10 20 and 50 µg/ml extracts, the total ascorbic acids in fresh strawberry extracts was found to be lowest and moderate in canned strawberry extracts. However, factors such as environmental and climatic factors in which the various fruits are grown are known to contribute significantly to the levels of ascorbic acid in fruits were not considered and could have played a great significant in this study.
The maximum concentration of ascorbic acid determined in fresh pineapple samples was 28.800± 0.363µg/ml while the least was 7.217 ± 0.094. For the canned samples, the maximum and minimum values obtained were 34.183 and 7.983 µg/ml respectively whereas for frozen samples, the values ranged between 30.950 and 5.050. From the observations, it is clear that frozen samples of both pineapples and strawberry shows relatively high concentration of ascorbic acid, fresh samples showed lowest concentrations over all the states and canned showed moderate concentrations.
The student’s t-test was used to check for any disparities between the processed and fresh samples. Student’s t-test is a tool used to statistically compare two or more samples with a control and see whether any significant differences occur between the two. Just like any other test for hypothesis, it is based on a normal distribution curve which is smooth, bell-shaped and symmetrical. For effective comparison, it was better to compare the fresh samples with the frozen and canned samples rather than to compare the processed samples amongst themselves. If any significant differences were to be observed, they could be attributed to the processing procedures involved, assuming that all other factors such as initial ascorbic levels of the various fruits and human error were constant.
For effective comparison, the null and the alternative hypothesis were formulated as:
Null hypothesis: H0 There is a significant difference in the concentration of ascorbic acid in the fresh sample as compared to the frozen and canned samples. This means that the mean of the fresh samples is not equal to that of frozen and canned sample.
Alternative hypothesis: Ha There is no any significant difference in the concentration of ascorbic acid in the fresh sample as compared to the frozen and canned samples. This means that the mean of the fresh samples is equal to that of frozen and canned sample.
The tabulated t-values give a range in which the calculated t-values should lie within for the null hypothesis to be valid, otherwise the alternative hypothesis holds. Thus, the basic rule in hypothesis testing is that the null hypothesis is to be rejected if the calculated t-value lies beyond the tabulated t-values and hence lies beyond the critical region. The calculated t-value for the frozen strawberry samples was found to be 3.114 while the critical value of t-test obtained from the t table at 95% level of confidence was +2.306 and -2.306 and thus the calculated t-value found to lie in the rejectable region. This definitely means that the null hypothesis was rejected and alternatively the contrary holds. Thus, for frozen strawberry samples, there are no significant differences between the frozen and fresh samples. This means that storing strawberries in the frozen state does not lead to interference of the level of ascorbic acid.
However, considering the calculated and tabulated t-values of canned strawberries, it is clear that the calculated t-value lies almost right in the middle of the acceptable region. Thus, the null hypothesis holds. It means that there is a significant difference in the levels of ascorbic acid between fresh and canned strawberry samples. This means that storage of strawberries in canned form affects the level of ascorbic acid.
Considering the calculated t-values of both frozen and canned pineapple samples, it is clear that the calculated t-values lie in the acceptable region and thus the null hypothesis is accepted. This means that the amount of ascorbic acid in frozen and canned strawberries is significantly different from that of fresh samples and hence is interfered with through the storage processes. This was however clearer in the pineapple samples as compared to the strawberry samples. The standard error involved in the calculation of the sample means was found to be less the 3 across all the samples.
Assumptions
In the calculation of concentration of ascorbic acid in the different forms of fruits using the standard calibration curve, it is assumed that the data obtained from the standards are linear, while the real data obtained deviate slightly from linearity.
It is also assumed that Beer- Lambert’s law is adhered to over all the concentration range. However, Beer and Lambert’s laws works best at low concentrations and deviations may be observed at higher concentration. Thus it is assumed that the line of best fit can be used to calculate the concentration of unknowns at any absorbance.
It was assumed that all the fruits were from the same locality hence grown under similar environmental and climatic conditions.
The student’s t-test assumes that all the data follow a normal curve exactly. Thus, its application in testing the hypothesis assumes that the data on the used samples also follow exactly a smooth, symmetrical and bell-shaped curve. The control sample, that is, the fresh pineapple and strawberry samples are also assumed to come from a normally distributed population.
Conclusion
The data obtained show that there is a very high possibility that storage of fruit samples in frozen and canned state interferes with the amount of ascorbic acid. Canned strawberry samples concur with this result whereas frozen ones do not. For the case of pineapples, both the samples concur with the hypothesis.
However, more research needs to be done involving larger samples and including other methods of preservations. The research can also be extended to other forms of processed foods such as beverages, milk and soft drinks.
Reference List
American Cancer Society 2013, Web.
Cadenas, E & Packer, L 2001, Handbook of Antioxidant, Mercel Dekker, New York.
Christian, DC 2004, Analytical Chemistry, 4th edition, John Wiley & Sons, New York.
Hathcork, JN 2004, Vitamin and mineral safety, Council for Responsible Nutrition, Washington, DC, pp. 1-3.
Hickey, S & Saul, A 2009, Vitamin C: The Real Story, Basic Health Publications, Inc., Laguna Beach, California.
Jagota, S & Dani, H 1982, ‘A New Colorimetric Technique for the Estimation of Vitamin C Using Folin Phenol Reagent’, Analytical Biochemistry, vol. 127, pp. 178-182.
Marques, KK, Renfroe, MH, Bowling, PBB, Lee, RE & Gloeckner, JW 2010, ‘Differences in Antioxidants Levels of Fresh, Frozen and Freeze-dried Strawberries and Strawberry Jam’, International Journal of Food Sciences and Nutrition, vol. 61 no. 8, pp. 759-769.
Mahdavi, R, Nikniaz, Z, Rafraf, M & Jouyban, A 2012, ‘Determination and Comparison of Total Polyphenol and Vitamin C Contents of Natural Fresh and Commercial Fruit Juices’, Pakistan Journal of Nutrition, pp. 968-972.
Porter, Y 2012, ‘Antioxidant Properties of Green Brocolli and Purple-Sprouting Brocolli under Different Cooking Conditions’, Bioscience Horizon, vol. 5, pp. 1-11.
Rababah, T Ereifej, K & Howard, L 2005, ‘Effects of Ascorbic Acid and Sehydration on Concentration of Total Phenolics, Antioxidants Capacity, Anthocyanins and Color in Fruits’, Journal of Agricultural Food Chem, vol. 53, pp. 4444-4447.
Rickman, J Barret, D & Bruhn, C. 2007, ‘Review: Nutritional Comparison of Fresh, Frozen and Canned Fruits and Vegetables, Part I. Vitamins C and B and Phenolic Compounds’, Journal of the Science of Food and Agriculture, vol. 87 no.7, pp. 930-944.
Skoog, A & West, D 2001, Fundamentals of Analytical Chemistry, 3rd edition, Brooks & Cole, New York.
Sinha, NS, Barta, JW, J & Cano, P 2012, Handbook of Fruits and Fruit Processing, Wiley-Blackwell, Ames, Iowa.
Underwood, A & Day, R 1991, Quantitative Analysis, 6th edition, Prentice-Hall, UK.
Vasco, C & Ruales, J 2008, ‘Total Phenolic Compounds and Antioxidants Capacities of Major Fruits from Ecuador’, Journal on Food Chem, vol. 111, pp. 816-823.
Wernery, U, Johnson, B & Abrahm, A 2012, ‘The effect of short-term heat treatment on vitamin C concentrations in camel milk’, Central Veterinary Research Laboratory, vol. 60 no. 3, pp. 1-2.