Background
There are varying types of resistivity tool; there designs are functional of the environmental conditions of their place of application (Meyer, 1998). For example, CBG Corporation recently improved upon their resistivity tools designs to revolutionize Geosteerers which are advancement over gamma probes to ensure reliability and ease drilling by steering boreholes and prevent non-productivity/water-wet-zones thereby saving drill costs. When these tools where tried in china’s Carbonated Reservoirs, they produced very articulate logs with the tools formation having more than 10,000 ohm-mts.
Principally, the resistivity-tools produced currents OF adjacent formations as well as measured responses of formations to the measured currents by using:
- Electrode tools (galvanic devices) that produced Laterologs, SN, LN, etc through:
- Utilization of electrodes pressed directly into the formation; and
-
-
- Two primary types:
- Lateral; and
- Normal; As well as
-
- Induction tools that produced ILM, ILD, etc through;
- Utilization of coils to induce a current and measure formation conductivity [where C = 1000/R] (Meyer, 1998).
- Frequently, quite a number of tool-type combinations are ran as induction-tools and may not produce any invaded-zone data.
Benefits of Using Resistivity Tools
Based o the fact that resistivity tools are diversified, their benefits are based on the tool types. For example, focused-resistivity-systems (designed for measuring thin-beds resistivities/high-resistivity rocks which contain high conductive-fluids) have economic benefits offered in the form of ‘guards’ or ‘laterologs’ (Zhipeng et.al., 2007). Particularly,
- Focused or guard logs can provide high resolution and great penetration under conditions where other resistivity systems may fail and Focused-resistivity devices use guard electrodes above and below the current electrode to force the current to flow out into the rocks surrounding the well (Wu and Wisler, 1990). The depth of investigation is considered to be about three times the length of one guard, so a 1.8 m guard should investigate material as far as 5.5 m from the borehole (Wu and Wisler, 1990). The sheetlike current pattern of the focused devices increases the resolution and decreases the effect of adjacent beds in comparison with the normal devices;
- Microfocused devices include all the focusing and measuring electrodes on a small pad; they have a depth of investigation of only several centimeters (Wu and Wisler, 1990); this is because the geometric factor, which is related to the electrode spacing, is difficult to calculate for focused devices;
- Calibration is usually carried out in a test well or pit where resistivities are known (Hagiwara, 1996). When this is done, the voltage recorded can be calibrated directly in terms of resistivity- zero resistivity can be checked when the entire electrode assembly is within a steel-cased interval of a well that is filled with water (Meyer et al., 1997).
Since the introduction of electrical-well logging, there has been continual progress in borehole drilling for the promotion of petroleum extractions. This has further reduced the cost of producing petrol and related products internationally. According to MacCallum et. al., (1998), ‘of all the rock parameters measured by logging tools, the electrical resistivity is of particular importance’ (Hagiwara, 1996, p. 27). The need for resistivity-measurements incorporates the determination of the quantity of hydrocarbon constituent in formations (Bittarand Rodney, 1996). Equally, Dipmeter log enhance economic drilling as noted by Bittar and Rodney (1996):
- Although strike and dip can be determined from the analog record at the well using a stereo net, complete analysis is only possible with a computer (and because this resistivity-tool-based analysis are computer based, they are faster and more economical);
- Computer output usually consists of a graphic plot and a listing of results- the graphic plot displays the depth, true dip angle, and direction of dip by means of a symbol called a “tadpole” or an arrow and the angle and direction of the tool also is displayed (Wu and Wisler, 1990);
- The dipmeter is a good source of information on the location and orientation of primary sedimentary structures over a wide variety of hole conditions; and
- Even though, computer programs used to derive fracture locations and orientations from dipmeter logs are not as successful as those designed for bedding, fractures usually are more irregular, with many intersections, and may have a wider range of dip angles within a short depth interval- suing the acoustic televiewer provides more accurate fracture information under most conditions (Bittar and Rodney, 1996, p.56).
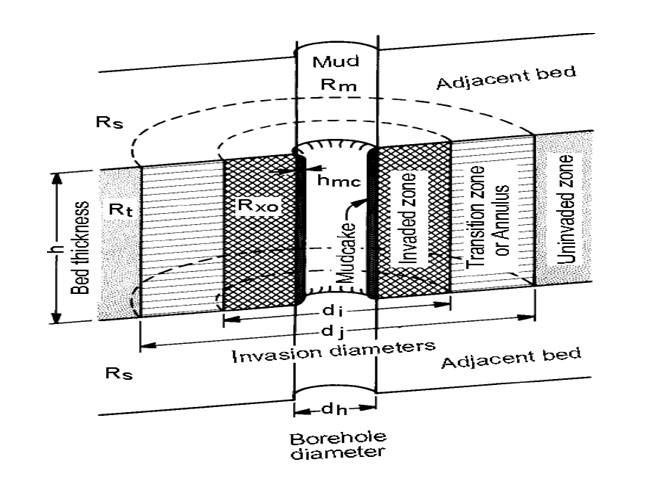
Conclusively, resistivity tool usage has enhanced better interpretation of the logging environment (Figure 3.1) by measuring the entire apparent resistivties of the region. They also enable faster and more accurate data analysis (Zhipeng et.al., 2007).
Conclusion and Recommendations
Conclusion
This study has viewed resistivity as the apparatus or machismo for logging; of late this engages the measurement of the electrical resistivity. The so measured resistivity has been noted to constitute a very significant property that expresses the potential of a material to opposing an electric-current’s flow. This characterized property is measured through the use of 4-electrical probes for the elimination of resistance against contacting leads. Often times, the resistivity logging has been made use of in exploring minerals as well as in the drill of water-wells- however it has found the most appreciated application in formation-evaluations as regarding oil and gas well drills. A majority of rocky-materials are insulated in nature, but the fluids which enclose them are usually conductors. These variations have necessitated various approaches towards drilling- and quite an number of resistivity tools which are made up of varying investigational lengths have been put into use for measuring formations of resistivity.
The paper noted that ordinarily, during drillings, the drill-fluid invades the formation/changes occurring in the resistivity and the measurement is done using tools that work effectively at invaded zones. But the emphasis of the study was to elaborate of factors that affect resistivity-tools – special attention was paid to the functionality of multiple-resistivity tools (MPRs) and how they relate to multiple-propagation resistivity.
In achieving the aim of the study then, there is an insight into the guard which constitutes a deep-reading resistivity-tool that has been quite effective when used for thin-bed resolutions. Measuring propagation-resistivity may however be altered by invasions, varying dielectric-permittivity, eccentricity, as well as thin bed. Considering instances whereby there are reasonably high levels of dips, an adjacent bed or a formation-anisotropy becomes an appreciable factor for considering log responses and multiple-spacing or multiple-frequencies with propagation resistivity tools becomes an enablement for calculating multiple-independence sets of defined vertical/horizontal resistivity. Further more, the identification and quantification of anisotropic technology becomes very helpful in the determination of more boreholes as well as formation effects.
Even though a lot of credit could be given to resistivity tools in terms of effectiveness, it has been noted that:
When propagation resistivity tools made just one measurement, only the apparent resistivity could be determined. When they made two measurements, another parameter could be determined by assuming that the separation between the two measurements was totally caused by a single effect (Meyer, 1998, p.3).
However;
Many current propagation resistivity tools make several measurements. The primary purpose of multiple measurements is to be able to determine several parameters simultaneously. The effects that cause separation in the propagation resistivity measurements include anisotropy, eccentricity, anomalous dielectric effects, vertical resolution differences, borehole conductivity and invasion- some of these effects, such as borehole conductivity and vertical resolution differences, can be removed accurately without calculating other parameters simultaneously (Meyer, 1998, p.5).
This among, other reason noted in the paper constitute economic benefits for which resistivity tools have been used over the years.
Recommendations
Resistivity logging offers a way of well-logging by which there is the characterization of rocks or sediments that occur in boreholes through the measurement of the electrical resistivity. This constitutes a very significant property that expresses the potential of a material to opposing an electric-current’s flow and has been put to practical use at several places itemizing a number of credits to the usage. Without the applicability of resistivity tools to drilling, at some points once in a while, there have been a number of challenges.
To bring the challenges to minimal, it hereby recommended that more of resistivity tools should be structured for measuring formation resistances to specified applied electricity current- perhaps, clay formations/sands that comprise high salinity would always offer lesser resistivity, where as sands that comprise freshwater would naturally constitute high resistivity values- such as it is the case with hard-rock/dry formations.
The running of the induction-log is achieved with the help of air holes as well as a non-metallic case should be made more computable as possible to enhance the analytical process and as well further speed of data interpretations.
Presently, the decision of what resistivity tools to employ for drilling has always been one met with quite a lot of difficulty by petrophyscists. Even though, it is accepted generally that an induction toll is most appropriate for lower resistivity formations that are drilled using fresh/non-conducted mud, there is need to personify the application of resistivity tools based on function and workability as much as possible- this would be necessary to ensure easier usage of these tools. One significant effect to put into consideration during the period of making a choice of a tool for usage could be the contrasting of flushed-zone-resistivity (Rxo) which has to be in line with an actual formation resistivity (Rt).
Reference List
Bittar, M. and Rodney, P., 1996. The effects of rock anisotropy on MWD electromagnetic wave resistivity sensors. The Log Analyst, 12 (4), p.27.
Hagiwara, T., 1996. A new method to determine horizontal resistivity in anisotropic formations without prior knowledge of relative dip. SPWLA Annual Logging Symposium, 16 (19), p.24.
MacCallum, et. al., 1998. Determination and Application of Formation Anisotropy Using Multiple Frequency, Multiple Spacing Propagation Resistivity Tool from a Horizontal Well. SPWLA Annual Logging Symposium, 17 (9), p.23
Meyer, et al., 1997. Multi-parameter propagation resistivity logging. SPWLA Annual Logging Symposium, 45 (16), pp.46-49.
Meyer, W. H., 1998. Interpretation of propagation resistivity logs in high angle wells. SPWLA Annual Logging Symposium, 62 (3), pp.2-3.
Wu, J.Q. and Wisler, M. M., 1990. Effect of Eccentering MWD Tools on Electromagnetic Resistivity Measurements. SBWLA Annual Logging Symposium, 45 (3), pp.86-87.
Zhipeng et.al., 2007. Joint Inversion of Density and Resistivity Logs for the Improved Petrophysical Assessment of Thinly-Bedded Clastic Rock Formations. SPWLA Annual Logging Symposium, 7 (3), p.57-61.